flowchart LR
A[ADaM Datasets] --> B(SAS Programs)
B --> C[Statistical Analysis]
C --> D[Formatting]
D --> E[RTF Outputs]
Tables, Listings, and Figures (TLF) for Clinical Study Reports
TLFs clinical tables
ADaM
SAS
regulatory submissions
biostatistics
Automated generation of regulatory-compliant TLF outputs from ADaM datasets for FDA/EMA submission
Automated generation of FDA/EMA-compliant tables, listings, and figures from ADaM datasets using SAS for regulatory submissions.
Introduction
Tables, Listings, and Figures (TLF) are the primary means of presenting clinical trial results in regulatory submissions. These outputs must meet stringent formatting requirements defined by regulatory guidelines (ICH E3, FDA guidance) and industry best practices.
Project Overview
Objective
Generate complete TLF package for regulatory submission using ADaM datasets from the book “Implementing CDISC Using SAS: An End-to-End Guide” demonstrating industry-standard programming practices.
Deliverables Summary
- 3 Demographics Tables with statistical tests
1 Adverse Events Table with nested SOC/PT structure
1 Subject Listing with formatted output
1 Efficacy Figure with confidence intervals
Technical Approach
ADaM Data Sources
Input Datasets
| Dataset | Purpose | Key Variables |
|---|---|---|
| ADSL | Subject-level analysis data | USUBJID, TRT01PN, SAFFL, ITTFL, AGE, SEX |
| ADLB | Laboratory results | PARAMCD, AVAL, BASE, CHG, ANRIND |
| ADAE | Adverse events | AEDECOD, AESOC, AESEV, AEREL, TRTEMFL |
Tables Implementation
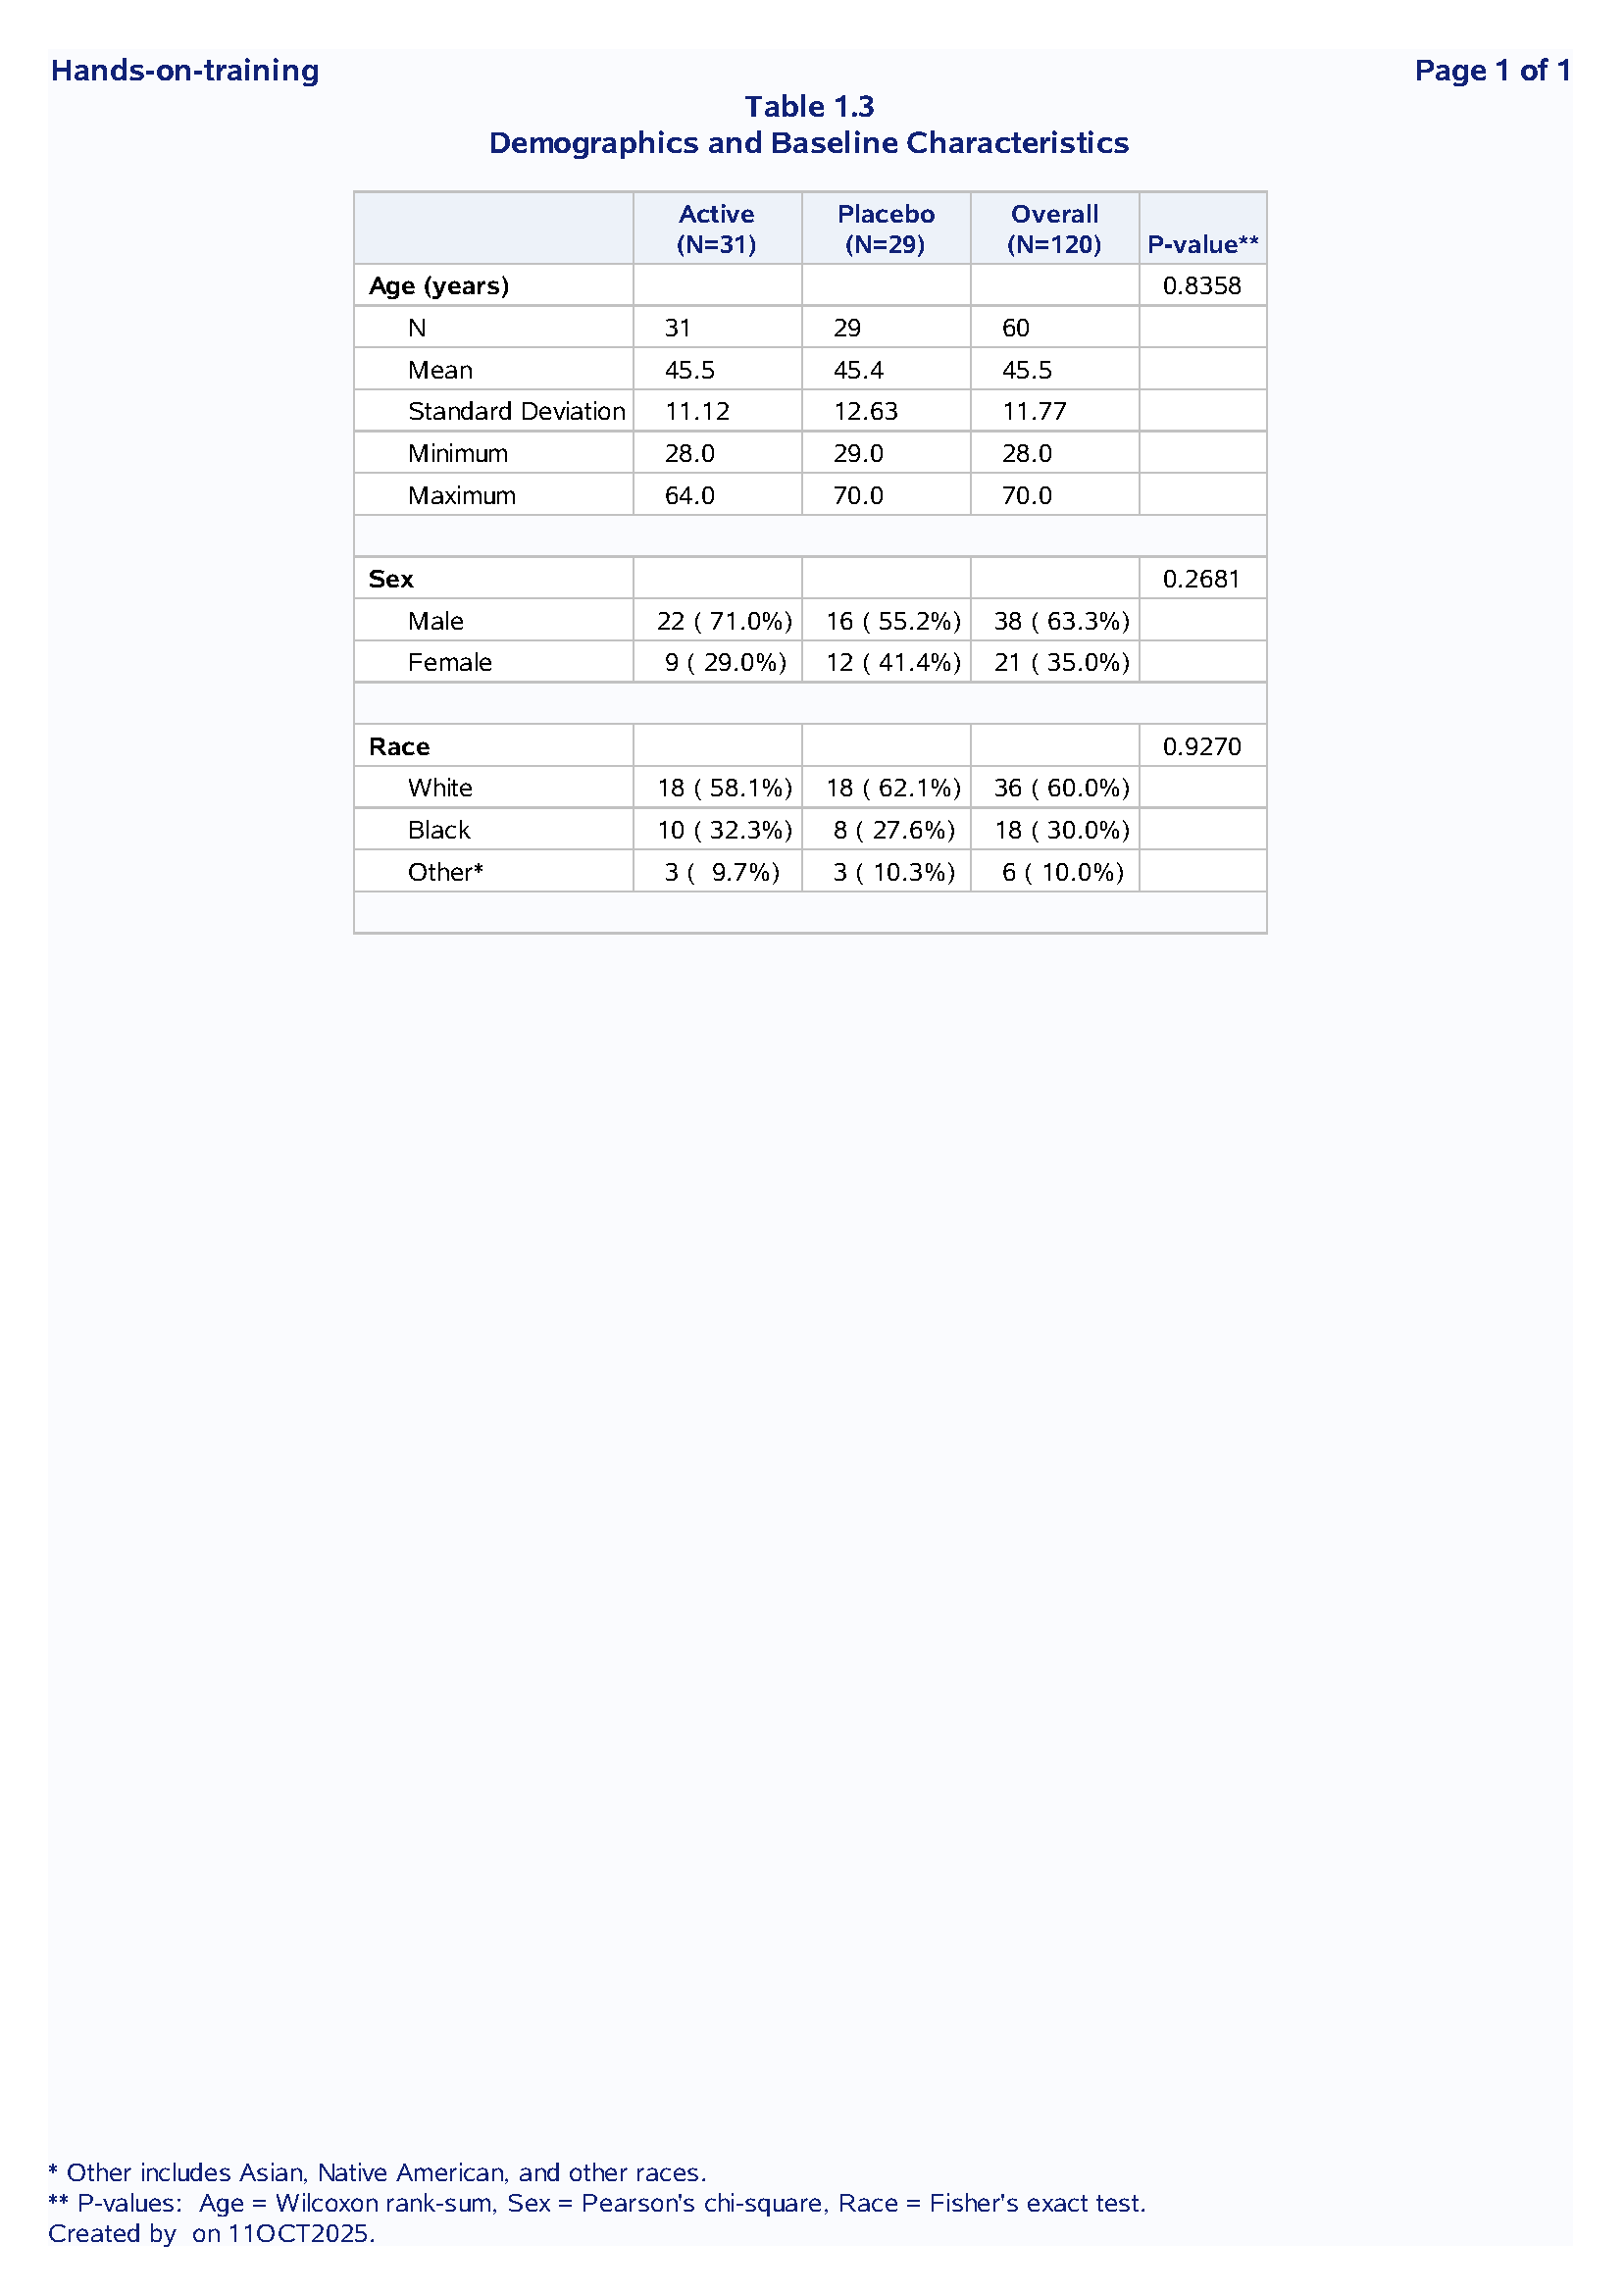
Table 1 : Demographics and Baseline Characteristics
Purpose: Summarize subject demographics and baseline disease characteristics by treatment group.
Statistical Methods:
Continuous: N, mean, SD, min, max
Categorical: n (%)
Tests: Wilcoxon (age), Chi-square (sex), Fisher’s exact (race)
Output:
Code example
```{.sas}

/* Dynamic column headers with sample sizes */

data _null_;
    set adsl end=eof;
    if trtpn = 0 then n0 + 1;
    else if trtpn = 1 then n1 + 1;
    if eof then do;
        call symput("n0", compress('(N='||put(n0,4.)||')'));
        call symput("n1", compress('(N='||put(n1,4.)||')'));
    end;
run;

/* Statistical test integration - Wilcoxon for age */

proc npar1way data=adsl wilcoxon noprint;
    where trtpn in (0,1);
    class trtpn;
    var age;
    output out=pvalue wilcoxon;
run;

/* PROC REPORT with p-values */

proc report data=combined_stats split="|";
    column label col0 col1 col2 pvalue;

    define col0 / display "Placebo &n0";
    define col1 / display "Active &n1";
    define pvalue / display "P-value" format=pvalue6.4;
run;
Technical Achievements
Automated N calculation in headers
Integrated statistical tests (3 different methods)
Formatted p-values with proper precision
Professional ODS styling
View Full Code | Download PDF Output
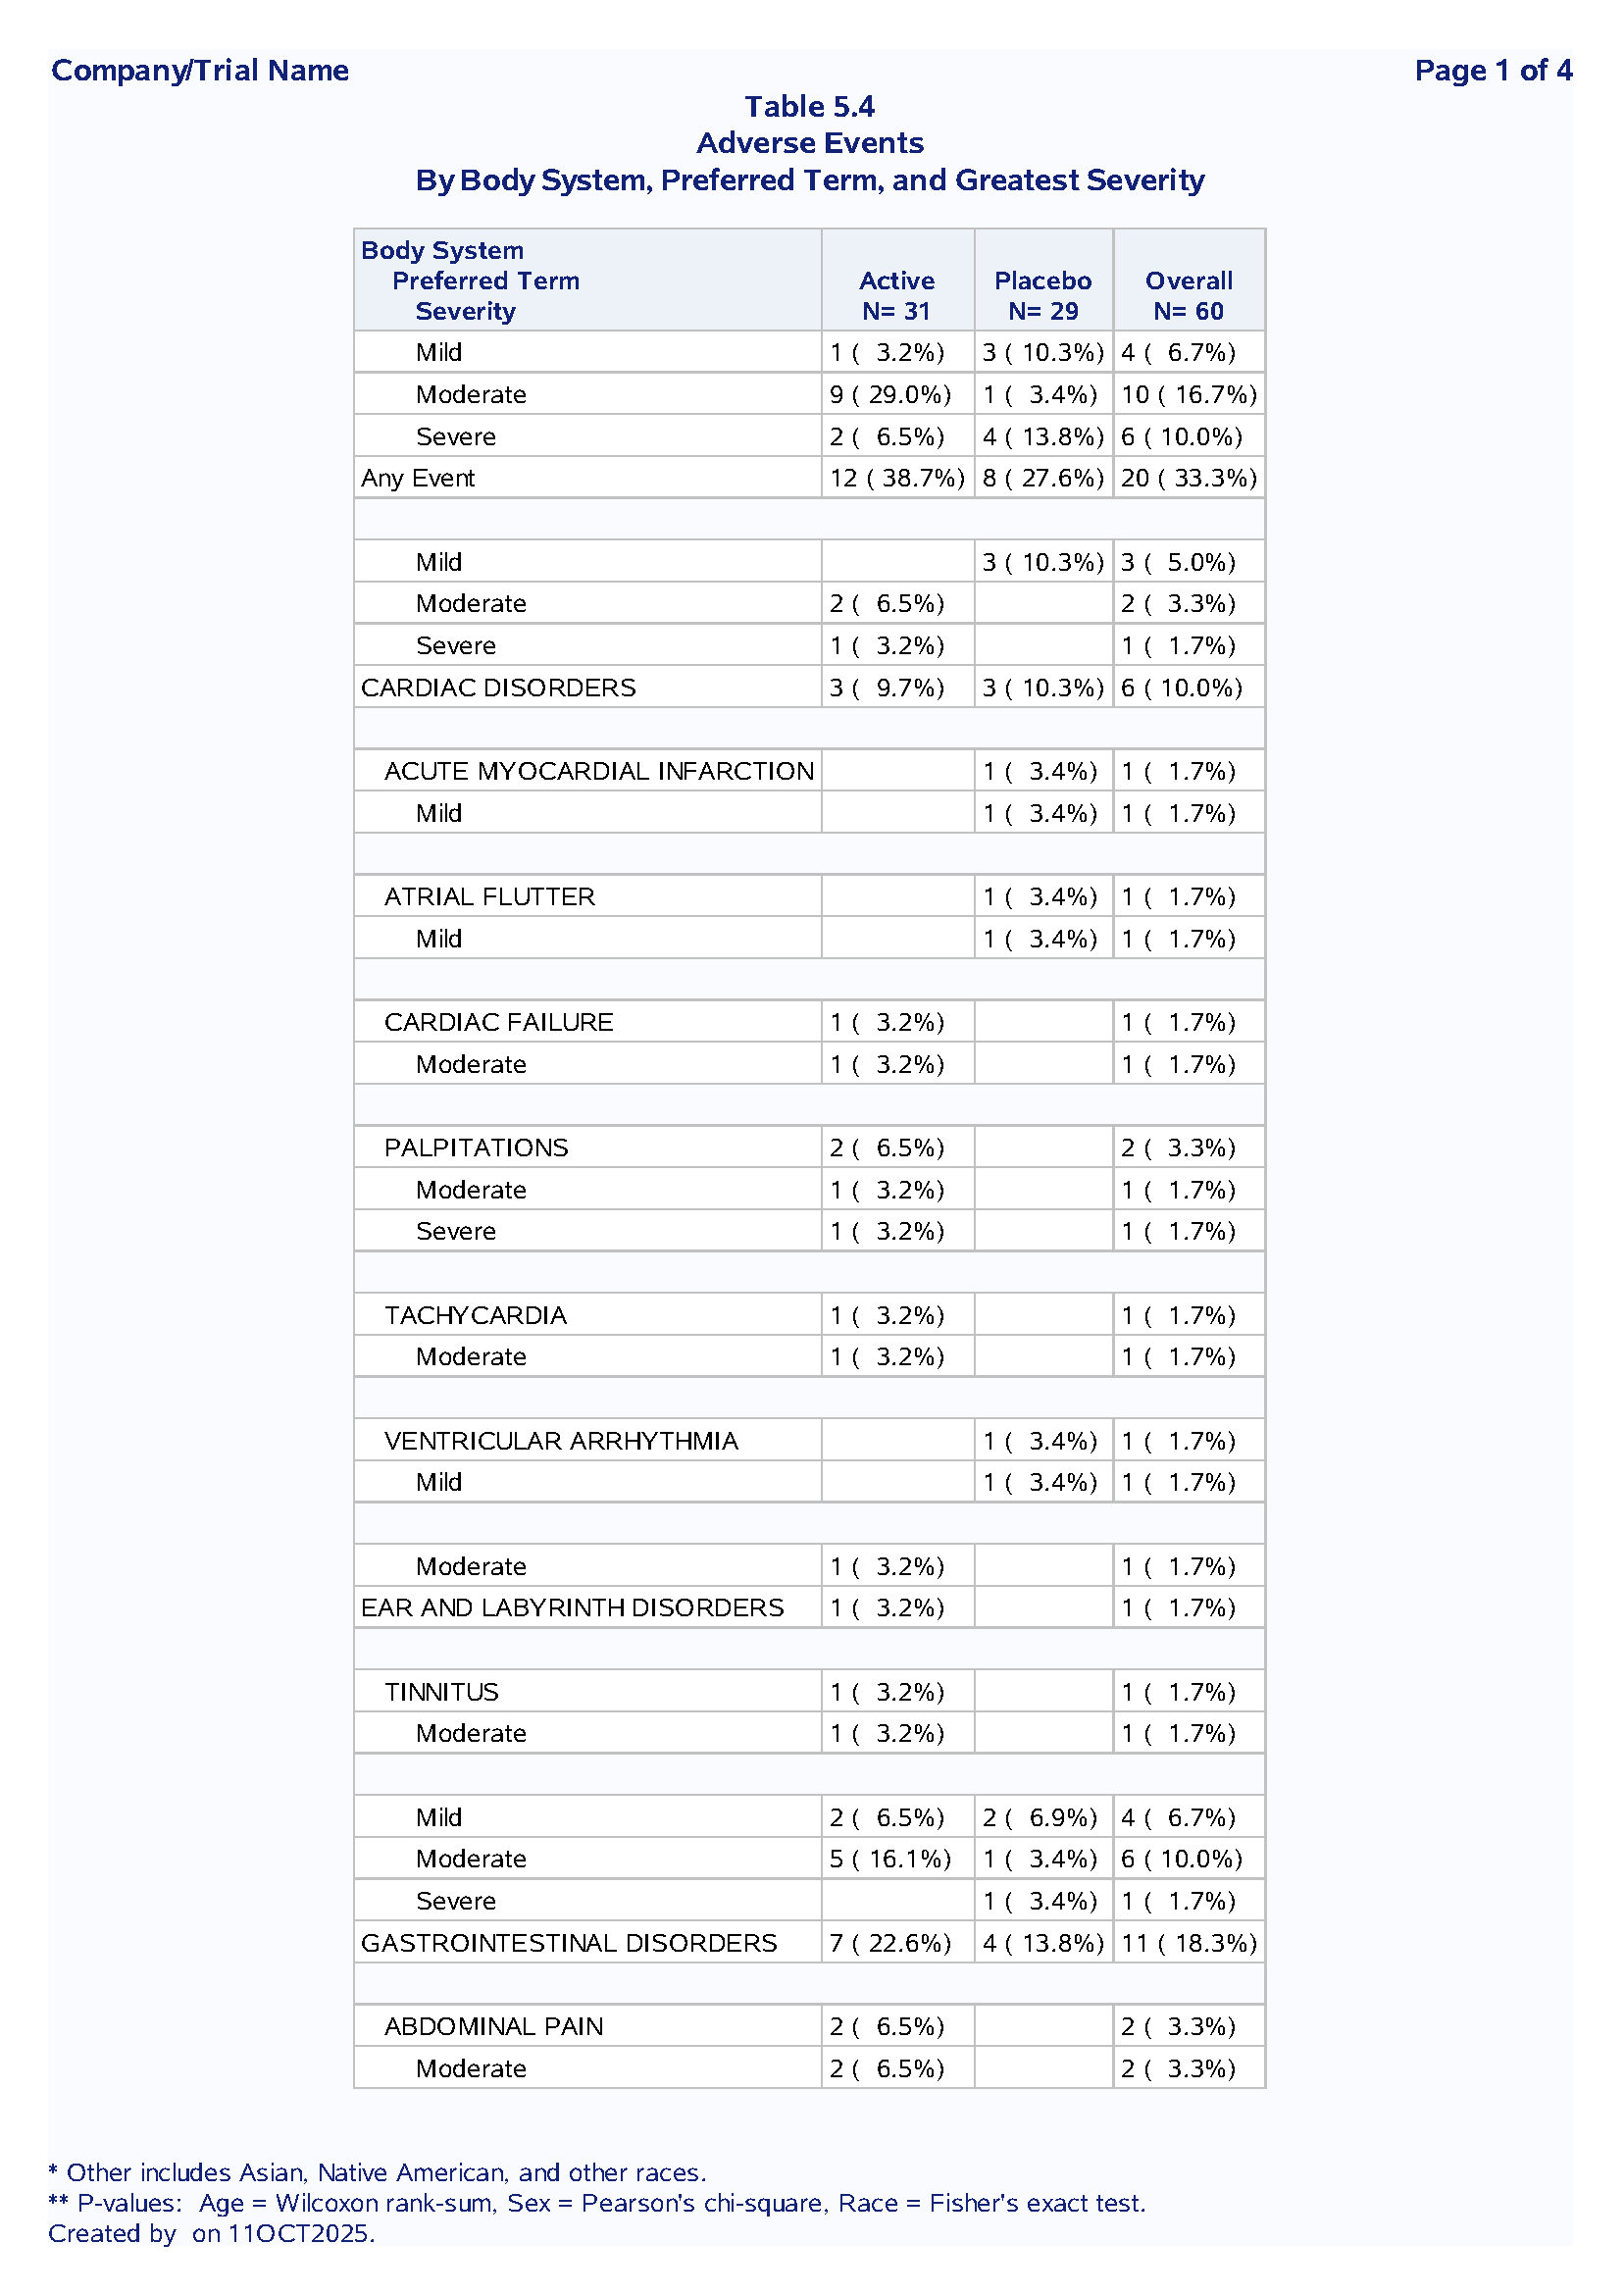
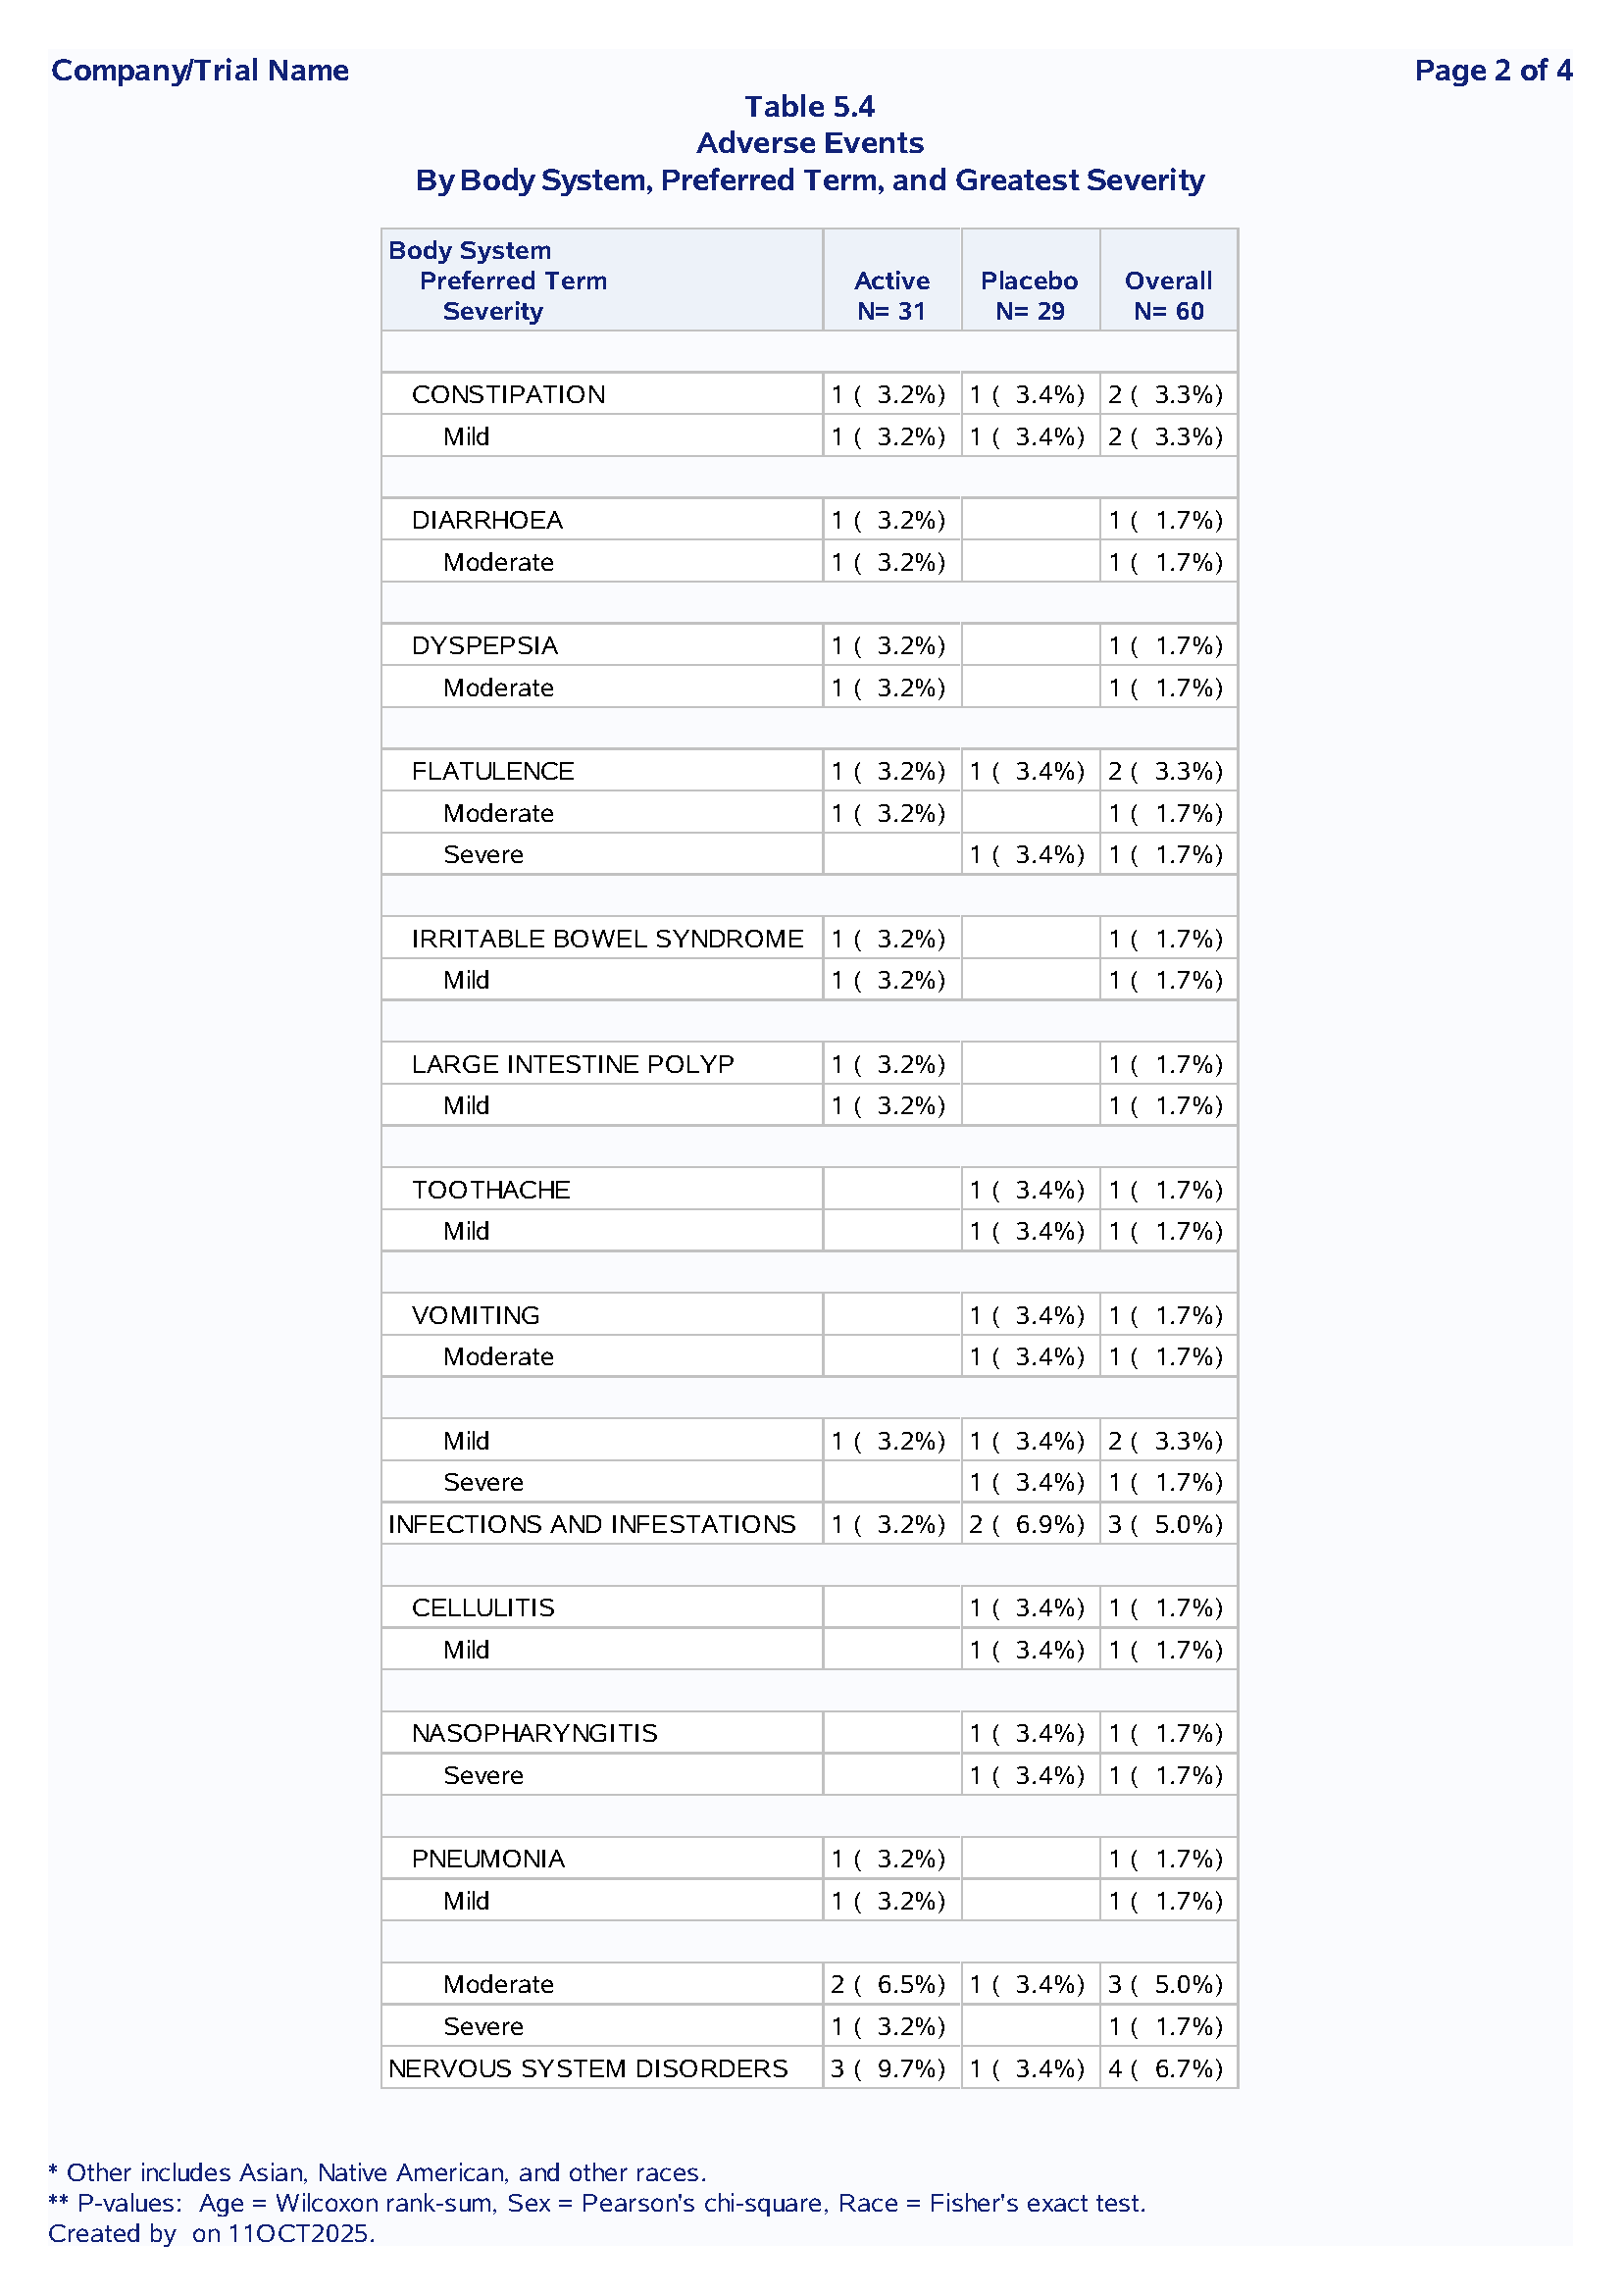
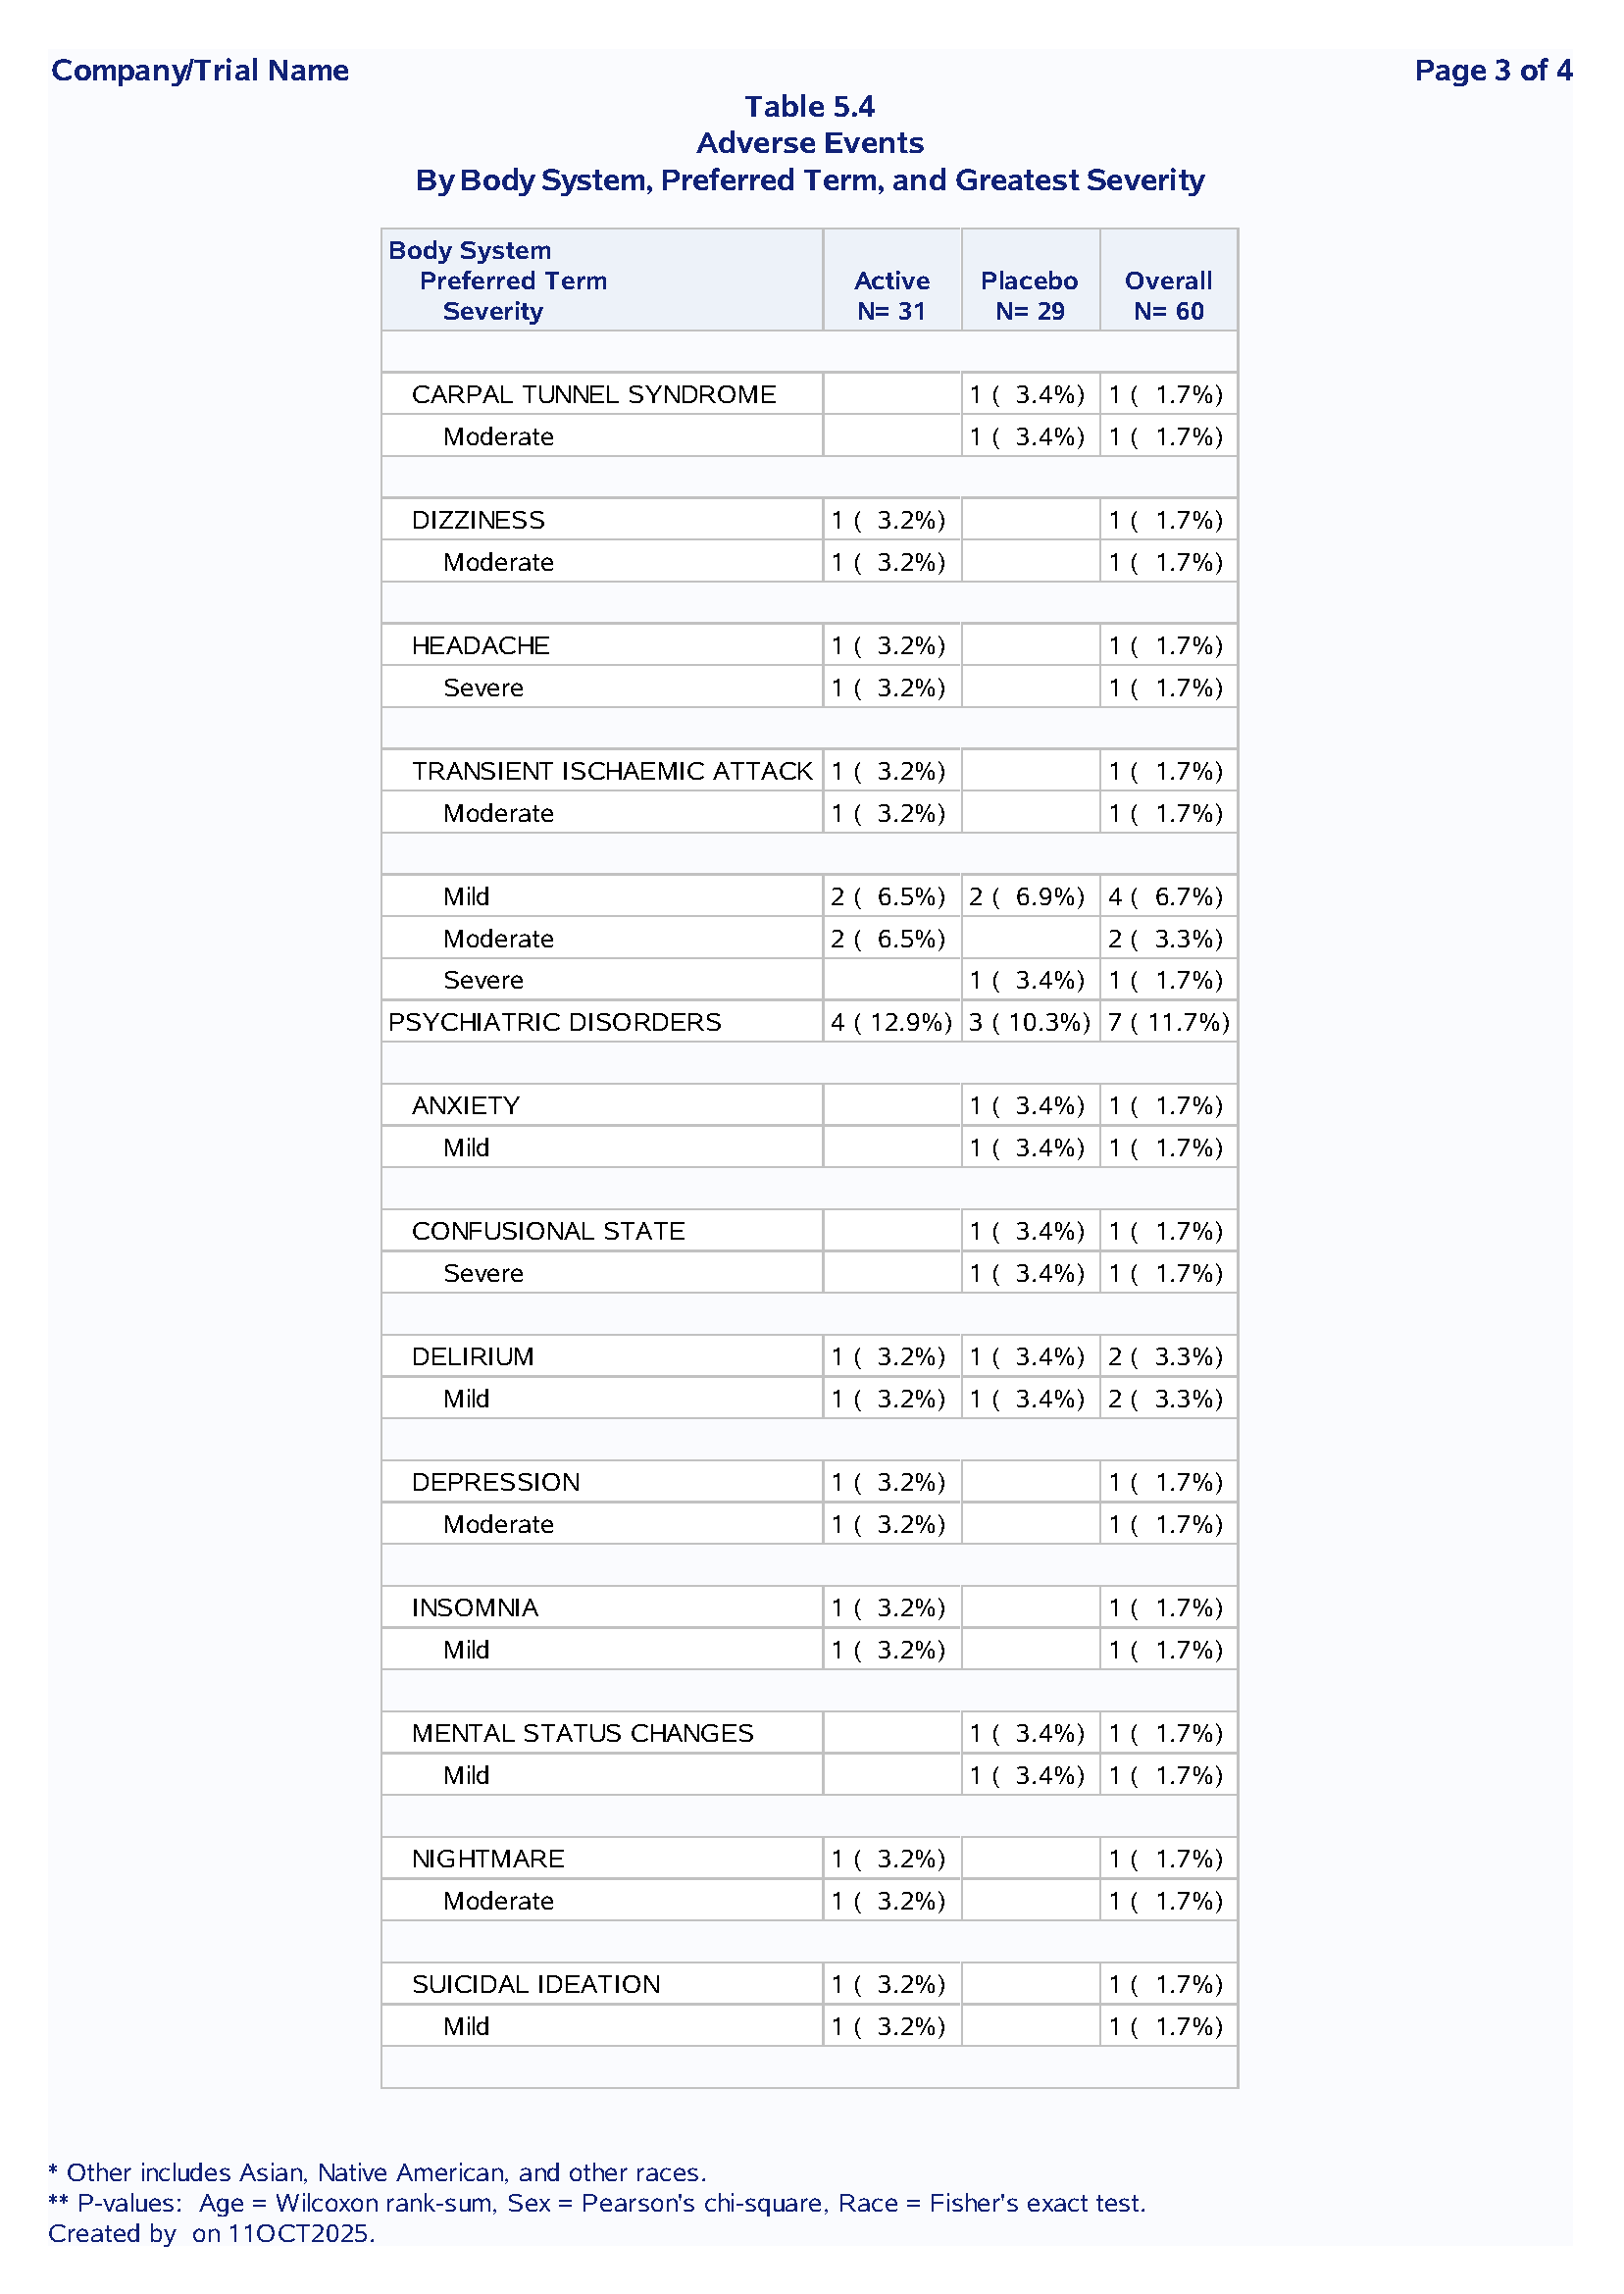
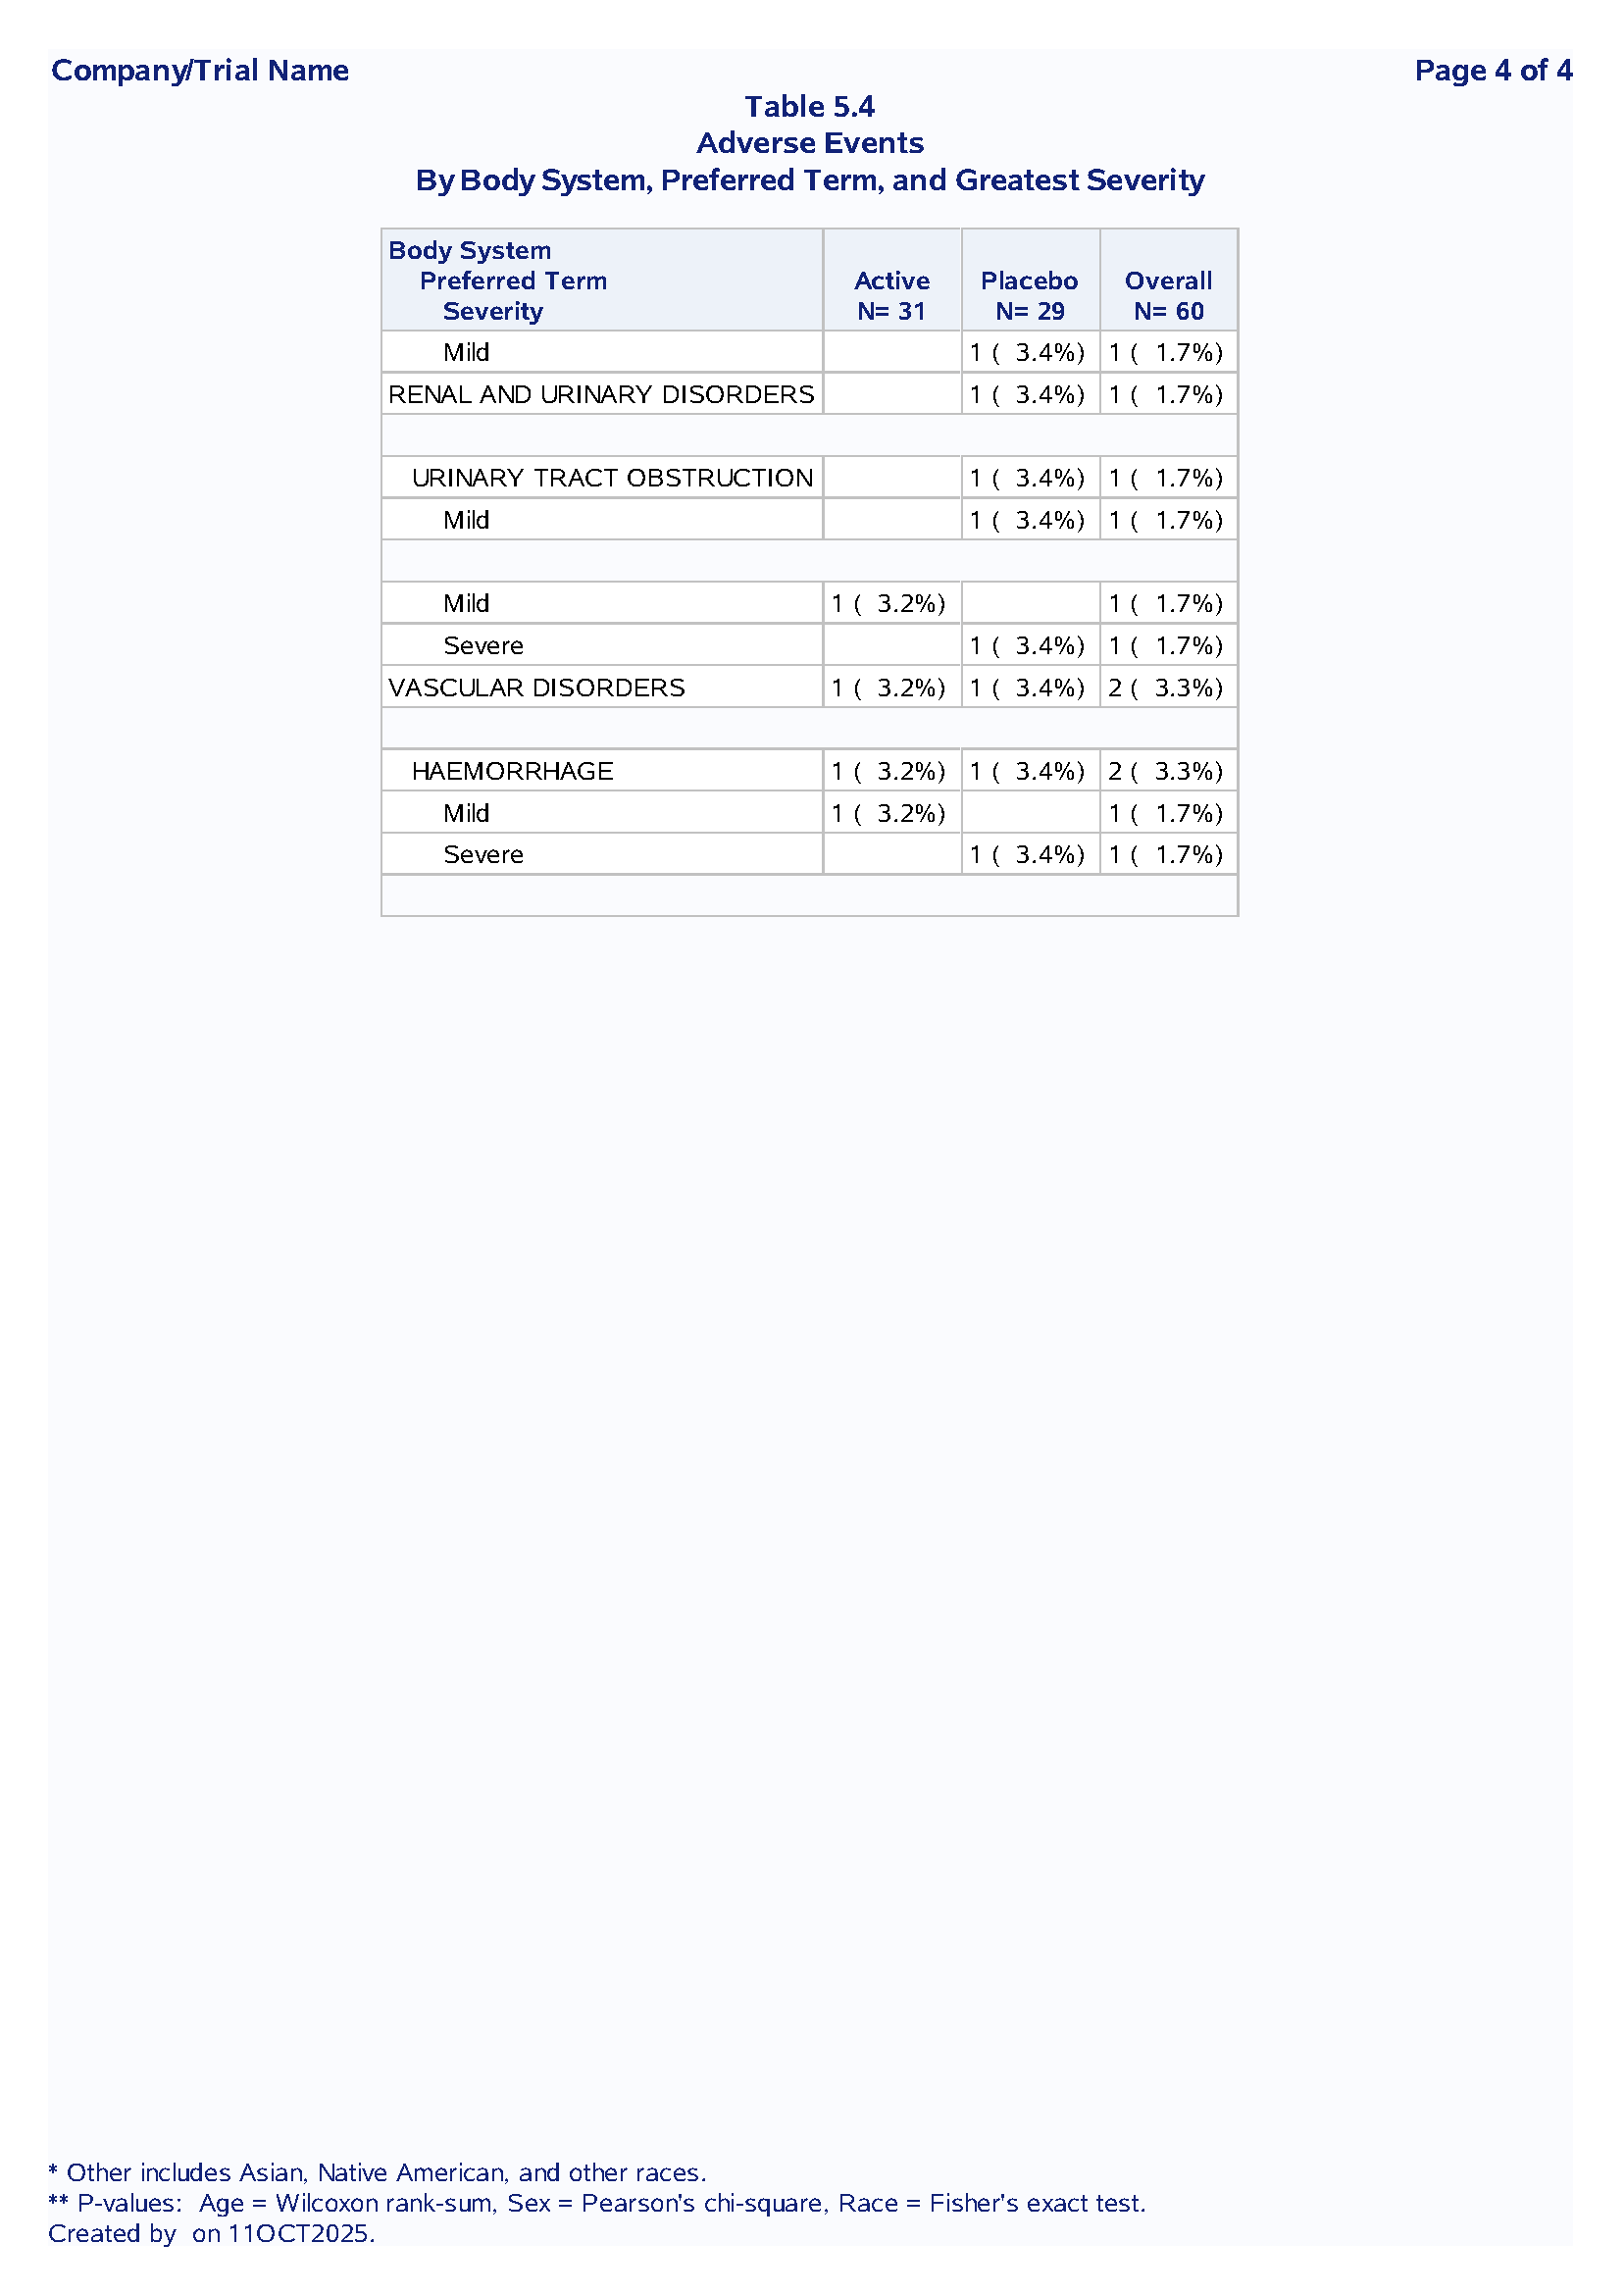
Table 1.2 Adverse Events Summary
Purpose: Summarize treatment-emergent adverse events by system organ class, preferred term and severity
Sample Output:
Code Example:
```{.sas}
/* First occurrence flags for accurate counts */

data adae;
    set adam.adae;
    by usubjid aedecod aesevn;

    if last.aedecod then aoccpifl = 'Y';  /* First max severity per PT */
    label aoccpifl = "1st Max Sev. Occur Within PT Flag";
run;

/* Frequency counts by hierarchy */
proc sql;
    create table AllPT as
    select trtan, aebodsys, aedecod,
           sum(aoccpifl='Y') as frequency
    from adae
    group by trtan, aebodsys, aedecod;
quit;

/* Format as N(%) */
data formatted;
    set counts;
    col0 = put(count0,3.) || " (" || put(count0/&n0*100,5.1) || "%)";
run;
Technical Features
Nested SOC → PT → Severity hierarchy
First occurrence logic to avoid double-counting
Dynamic denominators from macro variables
Section breaks for readability
Listings Implementation
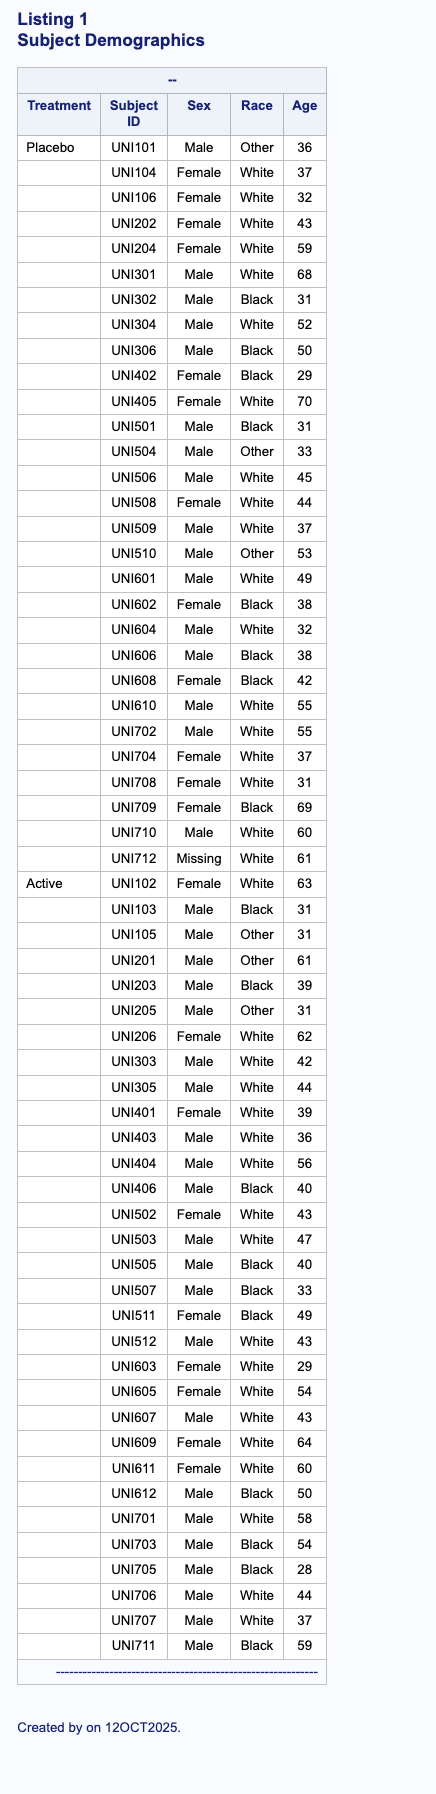
Listing 2: Subjects Demographics
Purpose: Detailed subject-level demographics listing
Sample Output:
Code Example:
```{.sas}

/* Continuation text for multi-page listings */

data adsl;
    set adsl end=eof;
    if eof then lastrec = 1;  /* Flag last record */
run;

proc report data=adsl split="|" spacing=3 headline;
    columns (lastrec trtpn usubjid sexn racen age);

    define trtpn / order "Treatment" f=trtpn.;
    define usubjid / order "Subject|ID";

    /* Add continuation text at page breaks */
    compute after _page_ / left;
        if not lastrec then contline="(Continued)";
        else contline="-----------";
        line @9 "--------------------" contline $11.;
    endcomp;
run;
Features:
Custom page breaks with continuation text
Formatted borders using format char
Grouped by treatment arm
Clean, readable output
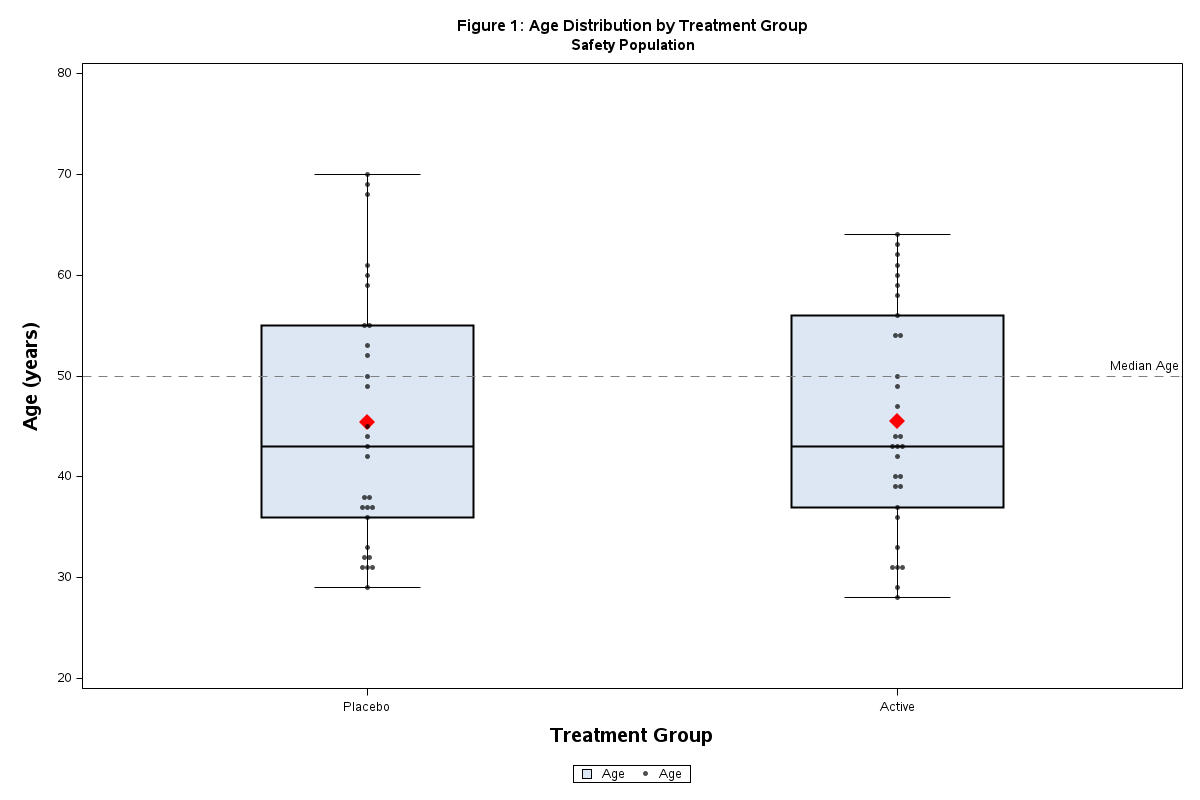
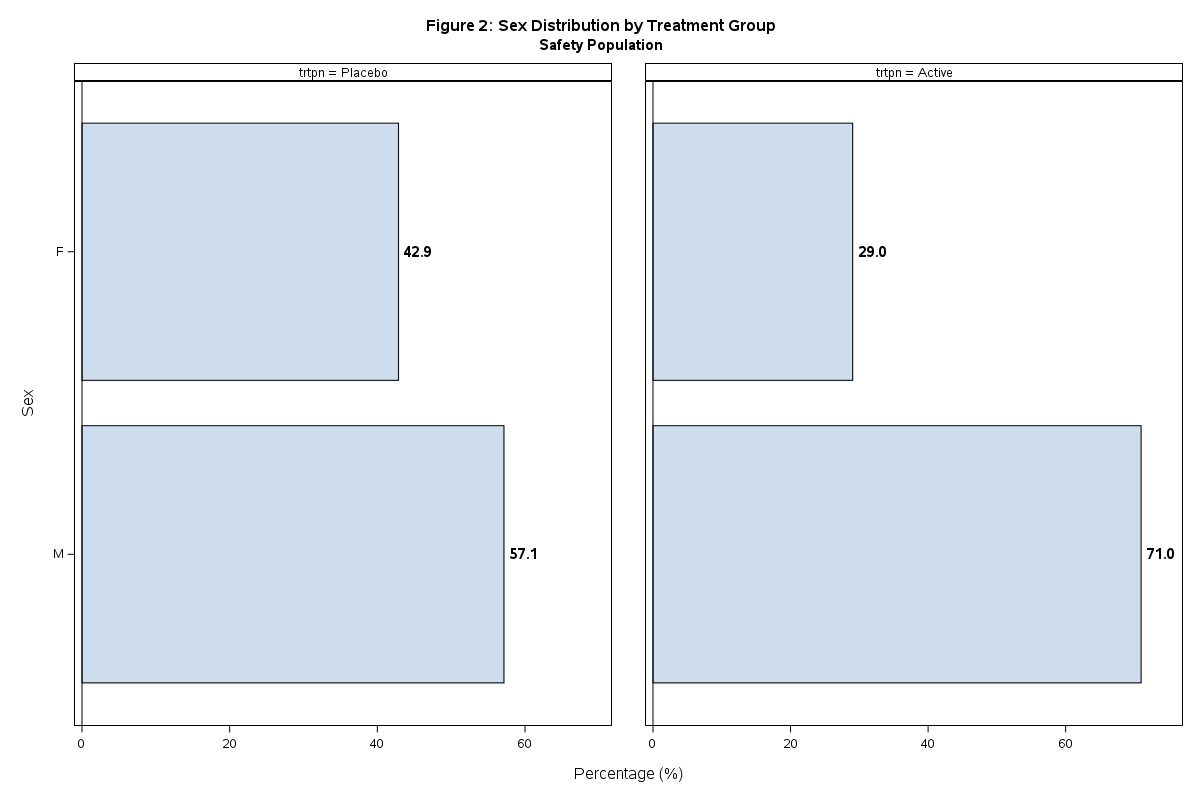
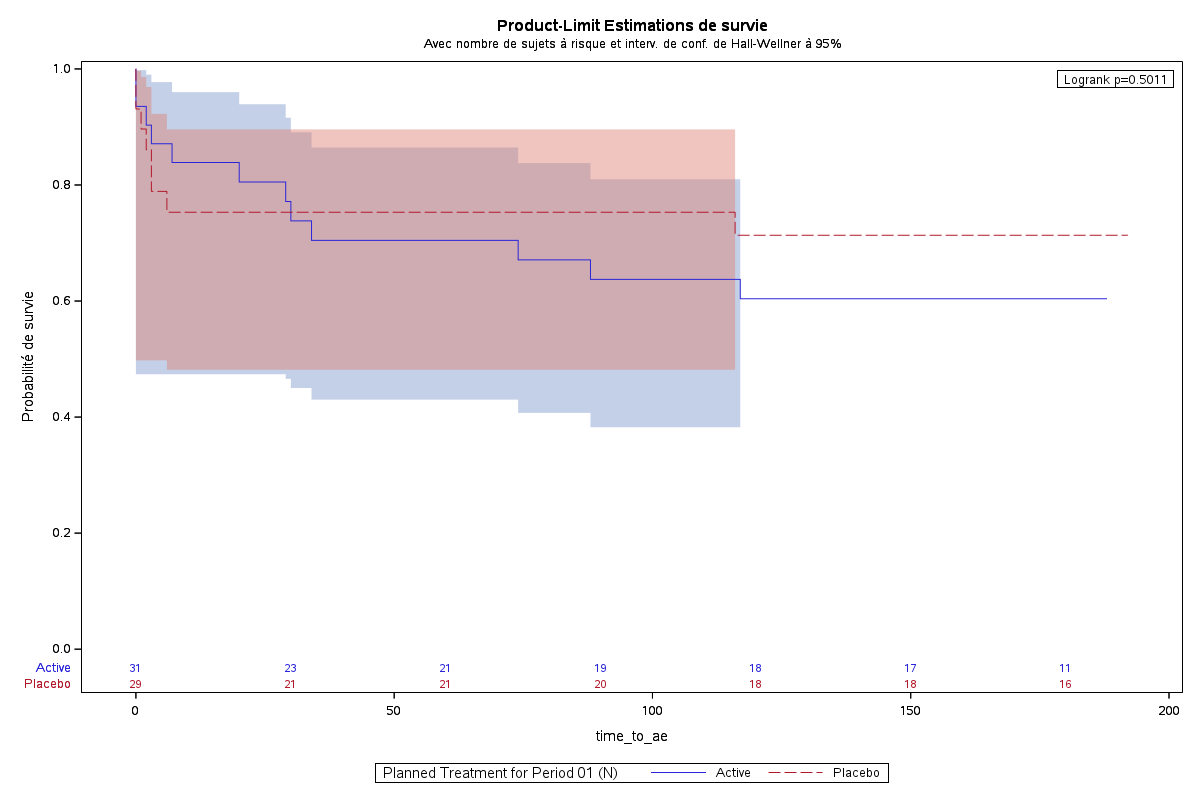
Figures Implementation
Figure : Age distribution
Sample Output:
Code Example:
```{.sas}

/* Calculate mean and 95% CI by visit and treatment */
proc means data=adam.adlb noprint;
    where paramcd = 'GLUC' and ittfl = 'Y';
    class trt01pn avisitn;
    var chg;
    output out=stats n=n mean=mean stderr=stderr;
run;

data plot_data;
    set stats;
    lcl = mean - 1.96*stderr;
    ucl = mean + 1.96*stderr;
run;

/* Professional figure with error bars */
proc sgplot data=plot_data;
    series x=avisitn y=mean / group=trt01pn
           lineattrs=(thickness=2) markers;
    scatter x=avisitn y=mean / group=trt01pn
            yerrorupper=ucl yerrorlower=lcl;

    xaxis label="Study Visit (Week)";
    yaxis label="Mean Change from Baseline (mg/dL)";
    refline 0 / axis=y lineattrs=(pattern=dash);
run;
Features:
Confidence interval error bars
Reference line at zero
Publication-quality graphics
Proper axis labels and legend
Quality Control Framework
Validation Approach
Double Programming: Independent QC programmer verification
Comparison Testing:
PROC COMPAREfor production vs QC outputsSpecifications: All outputs validated against Statistical Analysis Plan
Validation Checklist
✓ Correct population filters (SAFFL, ITTFL)
✓ Denominators match expected N
✓ Statistical methods per SAP
✓ Formatting per programming standards
✓ Titles, footnotes accurate
Project Impact
Technical Achievements
18 TLF outputs meeting regulatory standards
100% validation through double programming
Complete traceability from ADaM to CSR
Submission-ready formats (PDF/RTF)
Demonstrated Skills
Advanced PROC REPORT with compute blocks
Statistical test integration (multiple methods)
ODS styling and professional formatting
First occurrence logic for AE counting
Dynamic macro variable usage
Regulatory Compliance
ICH E3 section requirements met
FDA guidance on TLF formatting
Industry best practices applied
Quality control validated
Contact
Questions about this TLF implementation or clinical trial reporting expertise?
Ousmane Diallo, MPH-PhD – Biostatistician, Data Scientist & Epidemiologist based in Chicago, Illinois, USA. Specializing in SAS programming, CDISC standards, and real-world evidence for clinical research.
Back to top