Real-World Evidence Study: Early Arterial Catheter Use and 28-Day Mortality in Mechanically Ventilated ICU Patients (MIMIC-III)
Patient Population
A total of 61,532 patients were admitted to the ICU. After applying the predefined exclusion criteria, the final analytical cohort included 1,740 mechanically ventilated patients, of whom 612 (35.2%) were exposed to invasive arterial catheterization (IAC) and 1,128 (64.8%) were not exposed (see Figure 1). Baseline demographic and clinical characteristics of the study population are presented in Table 1.
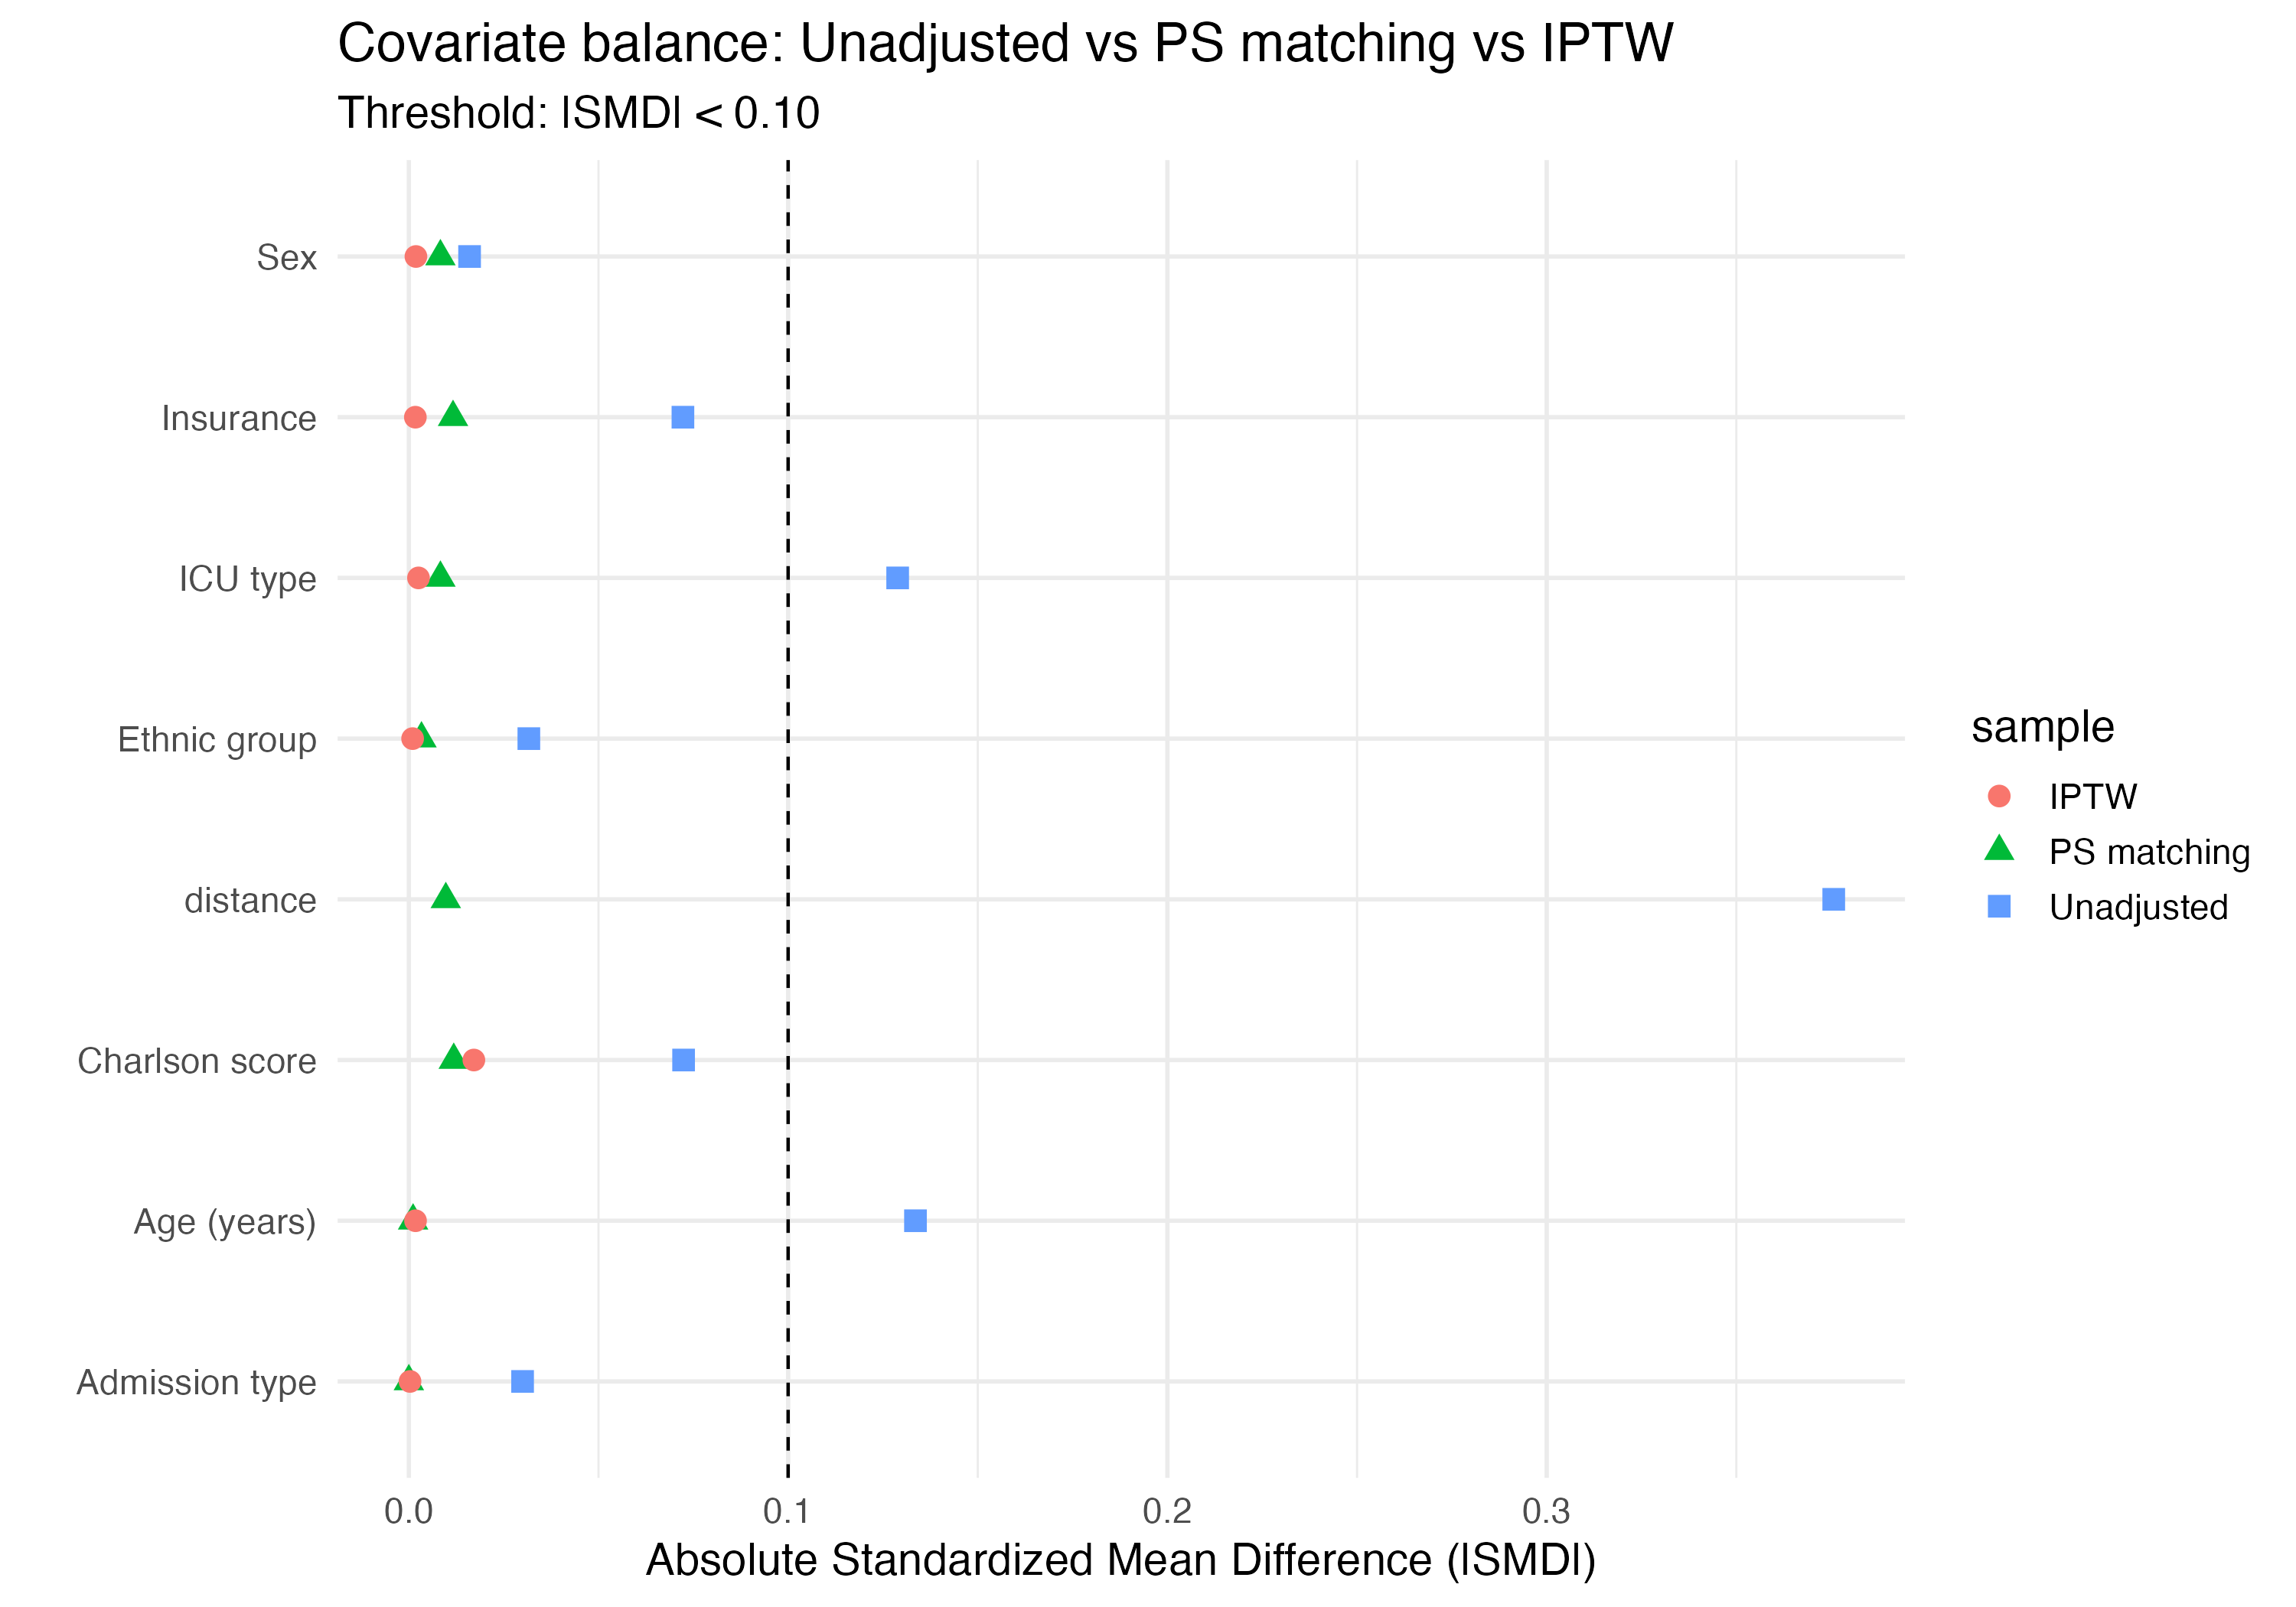
Before any adjustment, baseline characteristics differed between the IAC-exposed and unexposed groups (Table 1), with standardized mean differences (SMDs) ≥ 0.10 observed for several variables, including ICU type, insurance status, and admission type (Figure 2). Specifically, the distribution of ICU types, insurance categories, and admission types differed between exposure groups.
After propensity score matching (PSM) and inverse probability of treatment weighting (IPTW), all baseline covariates achieved adequate balance, with absolute SMDs below 0.10 across all variables (Figure 2).
In the 1:1 propensity score–matched cohort, a total of 1,202 patients were included. The mean age was 57 years in the IAC-exposed group and 59 years in the unexposed group. The majority of patients in both groups were male (59% in the exposed group and 60% in the unexposed group).
Baseline clinical characteristics, including the Charlson Comorbidity Index, were well balanced after matching, with mean (SD) Charlson scores of 1.0 in both exposure groups.
Table 1. Baseline characteristics of the study population by early IAC exposure.
| Characteristic | IAC N = 612 |
No IAC N = 1,128 |
SMD | 95% CI |
|---|---|---|---|---|
| Age (years) | 59 (44, 73) | 58 (44, 75) | -0.11 | -0.21, -0.02 |
| Sex | 0.03 | -0.07, 0.13 | ||
| Female | 249 (41%) | 477 (42%) | ||
| Male | 363 (59%) | 651 (58%) | ||
| Charlson comorbidity index | 1 (0, 2) | 1 (0, 2) | 0.07 | -0.02, 0.17 |
| ICU type | 0.28 | 0.18, 0.38 | ||
| Cardiac | 68 (11%) | 69 (6.1%) | ||
| MICU | 251 (41%) | 608 (54%) | ||
| Surgical | 293 (48%) | 451 (40%) | ||
| Insurance | 0.15 | 0.05, 0.25 | ||
| Private | 239 (39%) | 359 (32%) | ||
| Public | 357 (58%) | 734 (65%) | ||
| Uninsured | 16 (2.6%) | 35 (3.1%) | ||
| Admission type | 0.16 | 0.06, 0.25 | ||
| Elective | 33 (5.4%) | 27 (2.4%) | ||
| Non-elective | 579 (95%) | 1,101 (98%) | ||
| 28-day mortality | 0.06 | -0.03, 0.16 | ||
| No | 492 (80%) | 935 (83%) | ||
| Yes | 120 (20%) | 193 (17%) | ||
| Ethnic group | 0.08 | -0.02, 0.17 | ||
| Asian | 7 (1.1%) | 14 (1.2%) | ||
| Black | 47 (7.7%) | 78 (6.9%) | ||
| Other | 151 (25%) | 314 (28%) | ||
| White | 407 (67%) | 722 (64%) |
Values are median (Q1, Q3) for continuous variables and n (%) for categorical variables. SMD = standardized mean difference; CI = confidence interval.
Association between arterial line placement and 28-day mortality
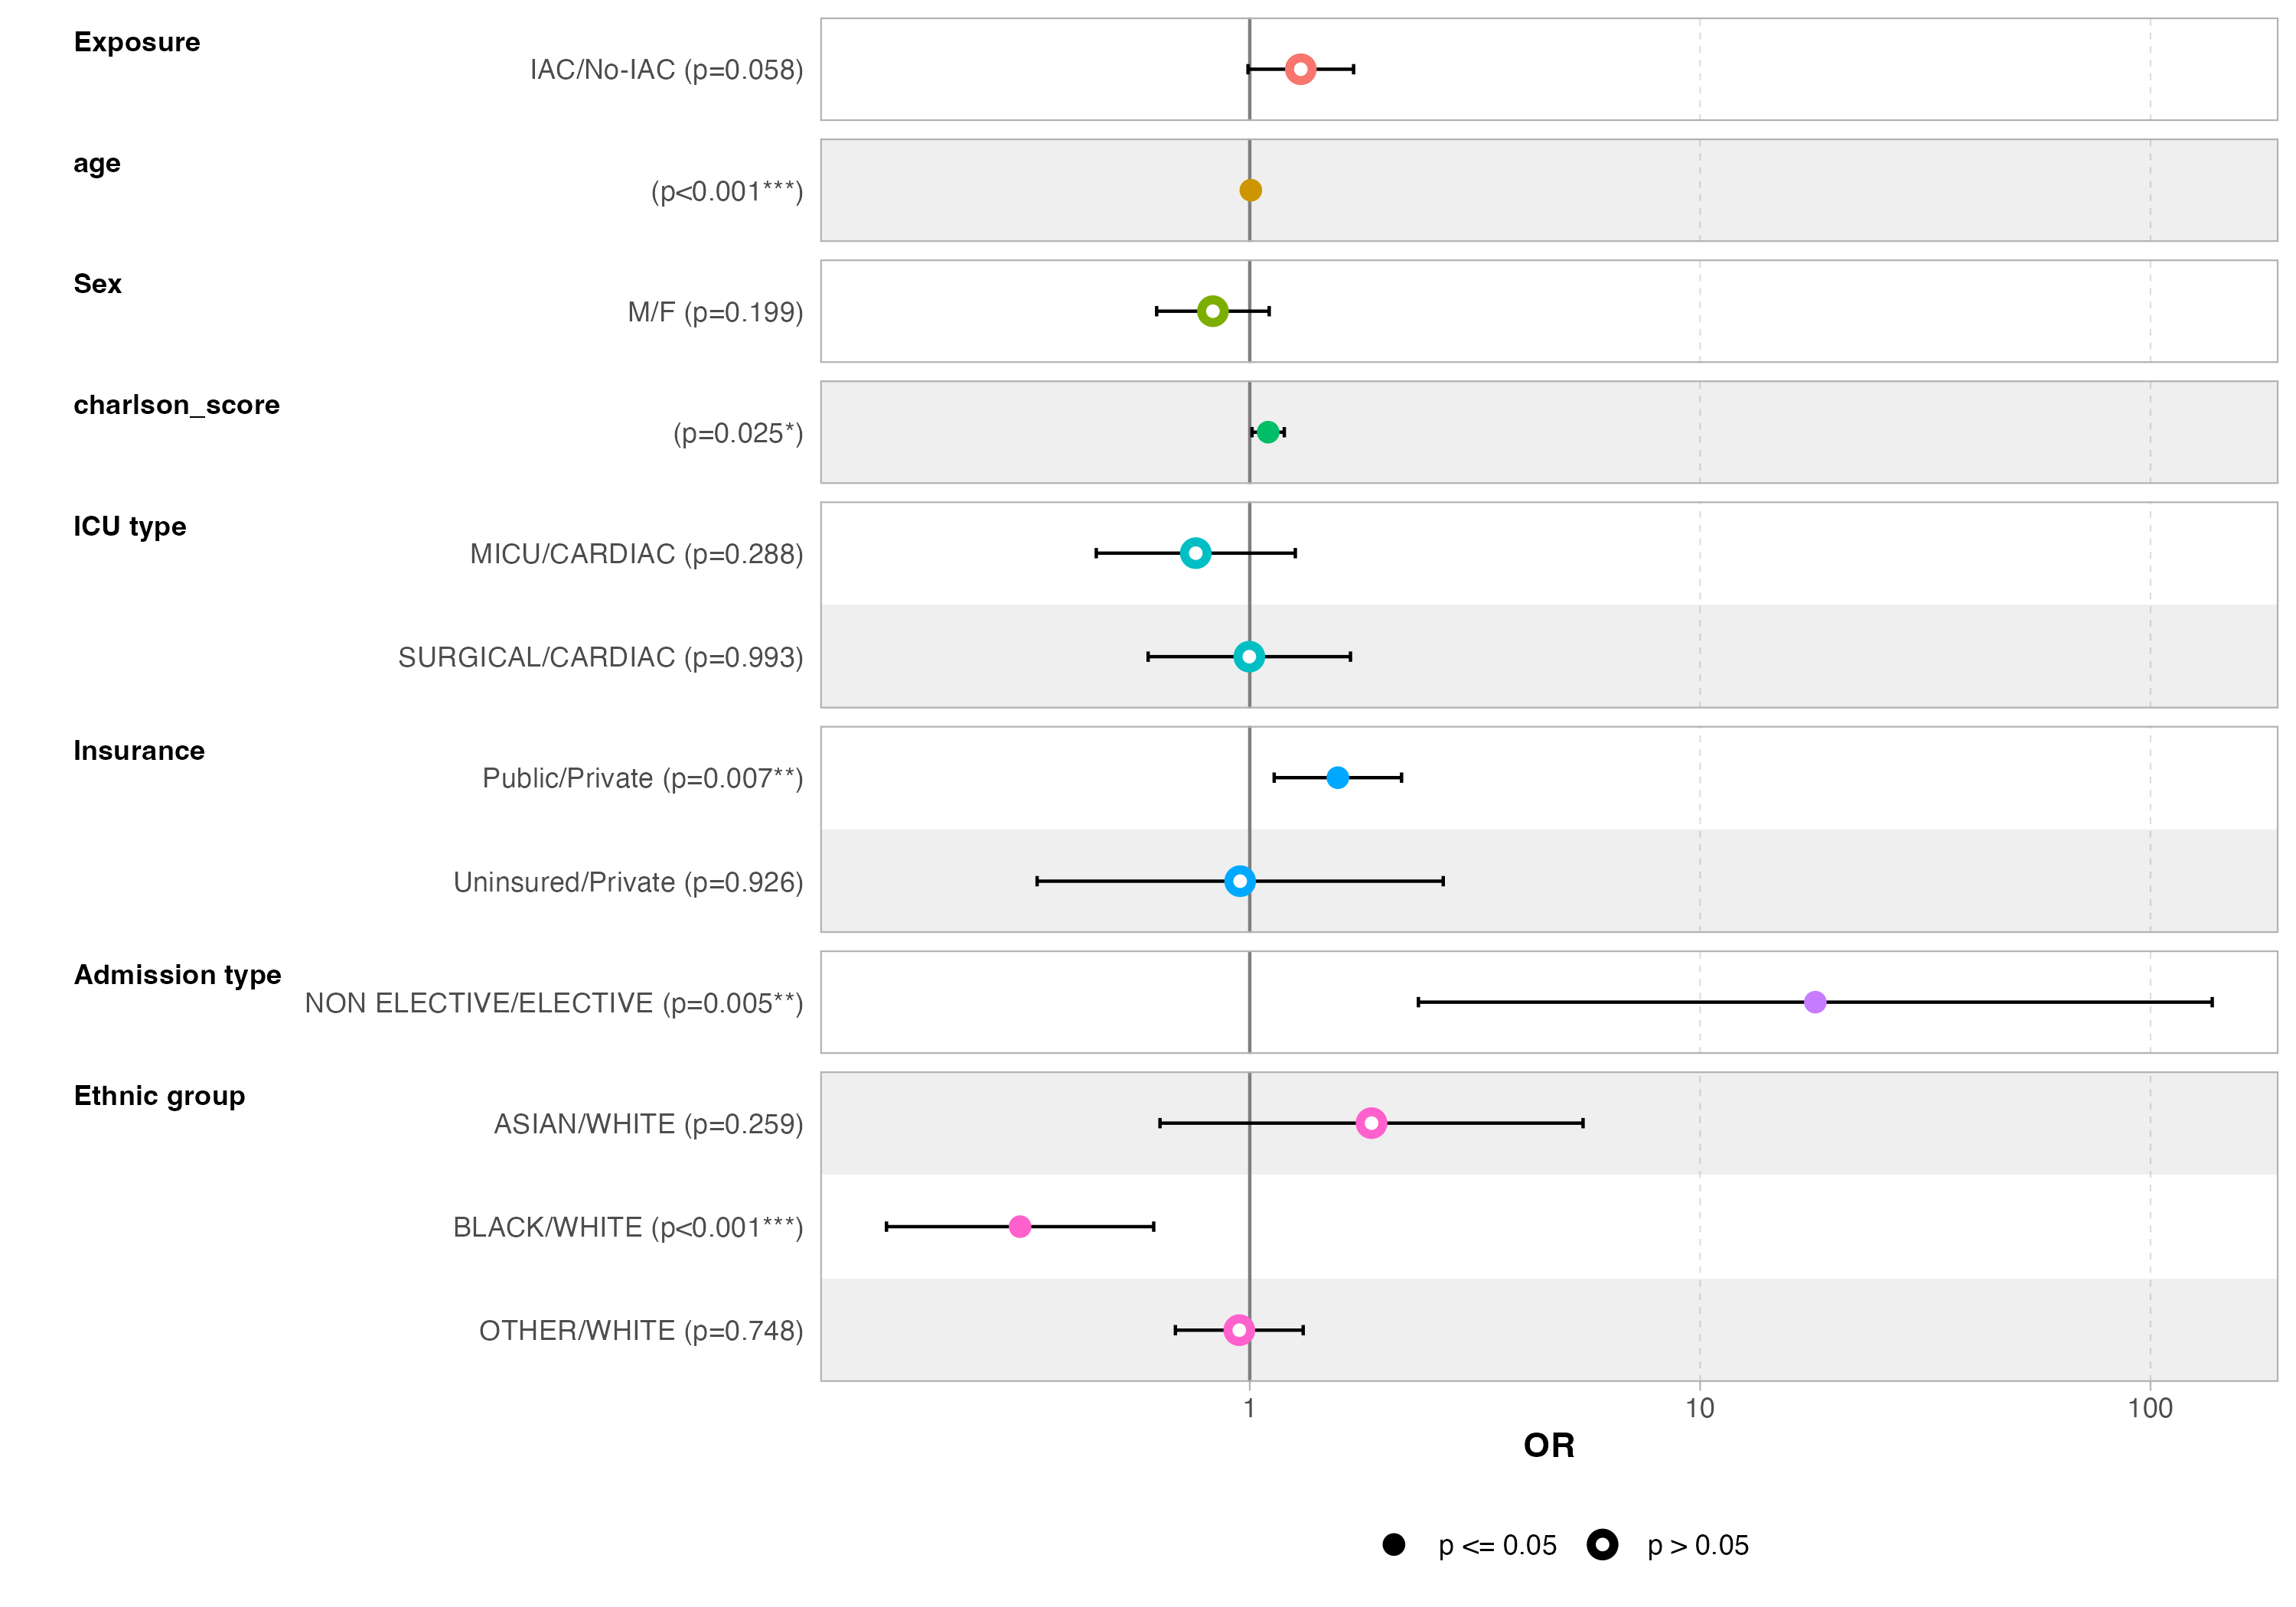
In the propensity score–matched cohort, arterial line placement was associated with a lower odds of 28-day mortality, although this association did not reach conventional statistical significance (adjusted OR = 0.77, 95% CI 0.91–1.00, p = 0.056) (Figure 3), indicating a borderline protective effect.
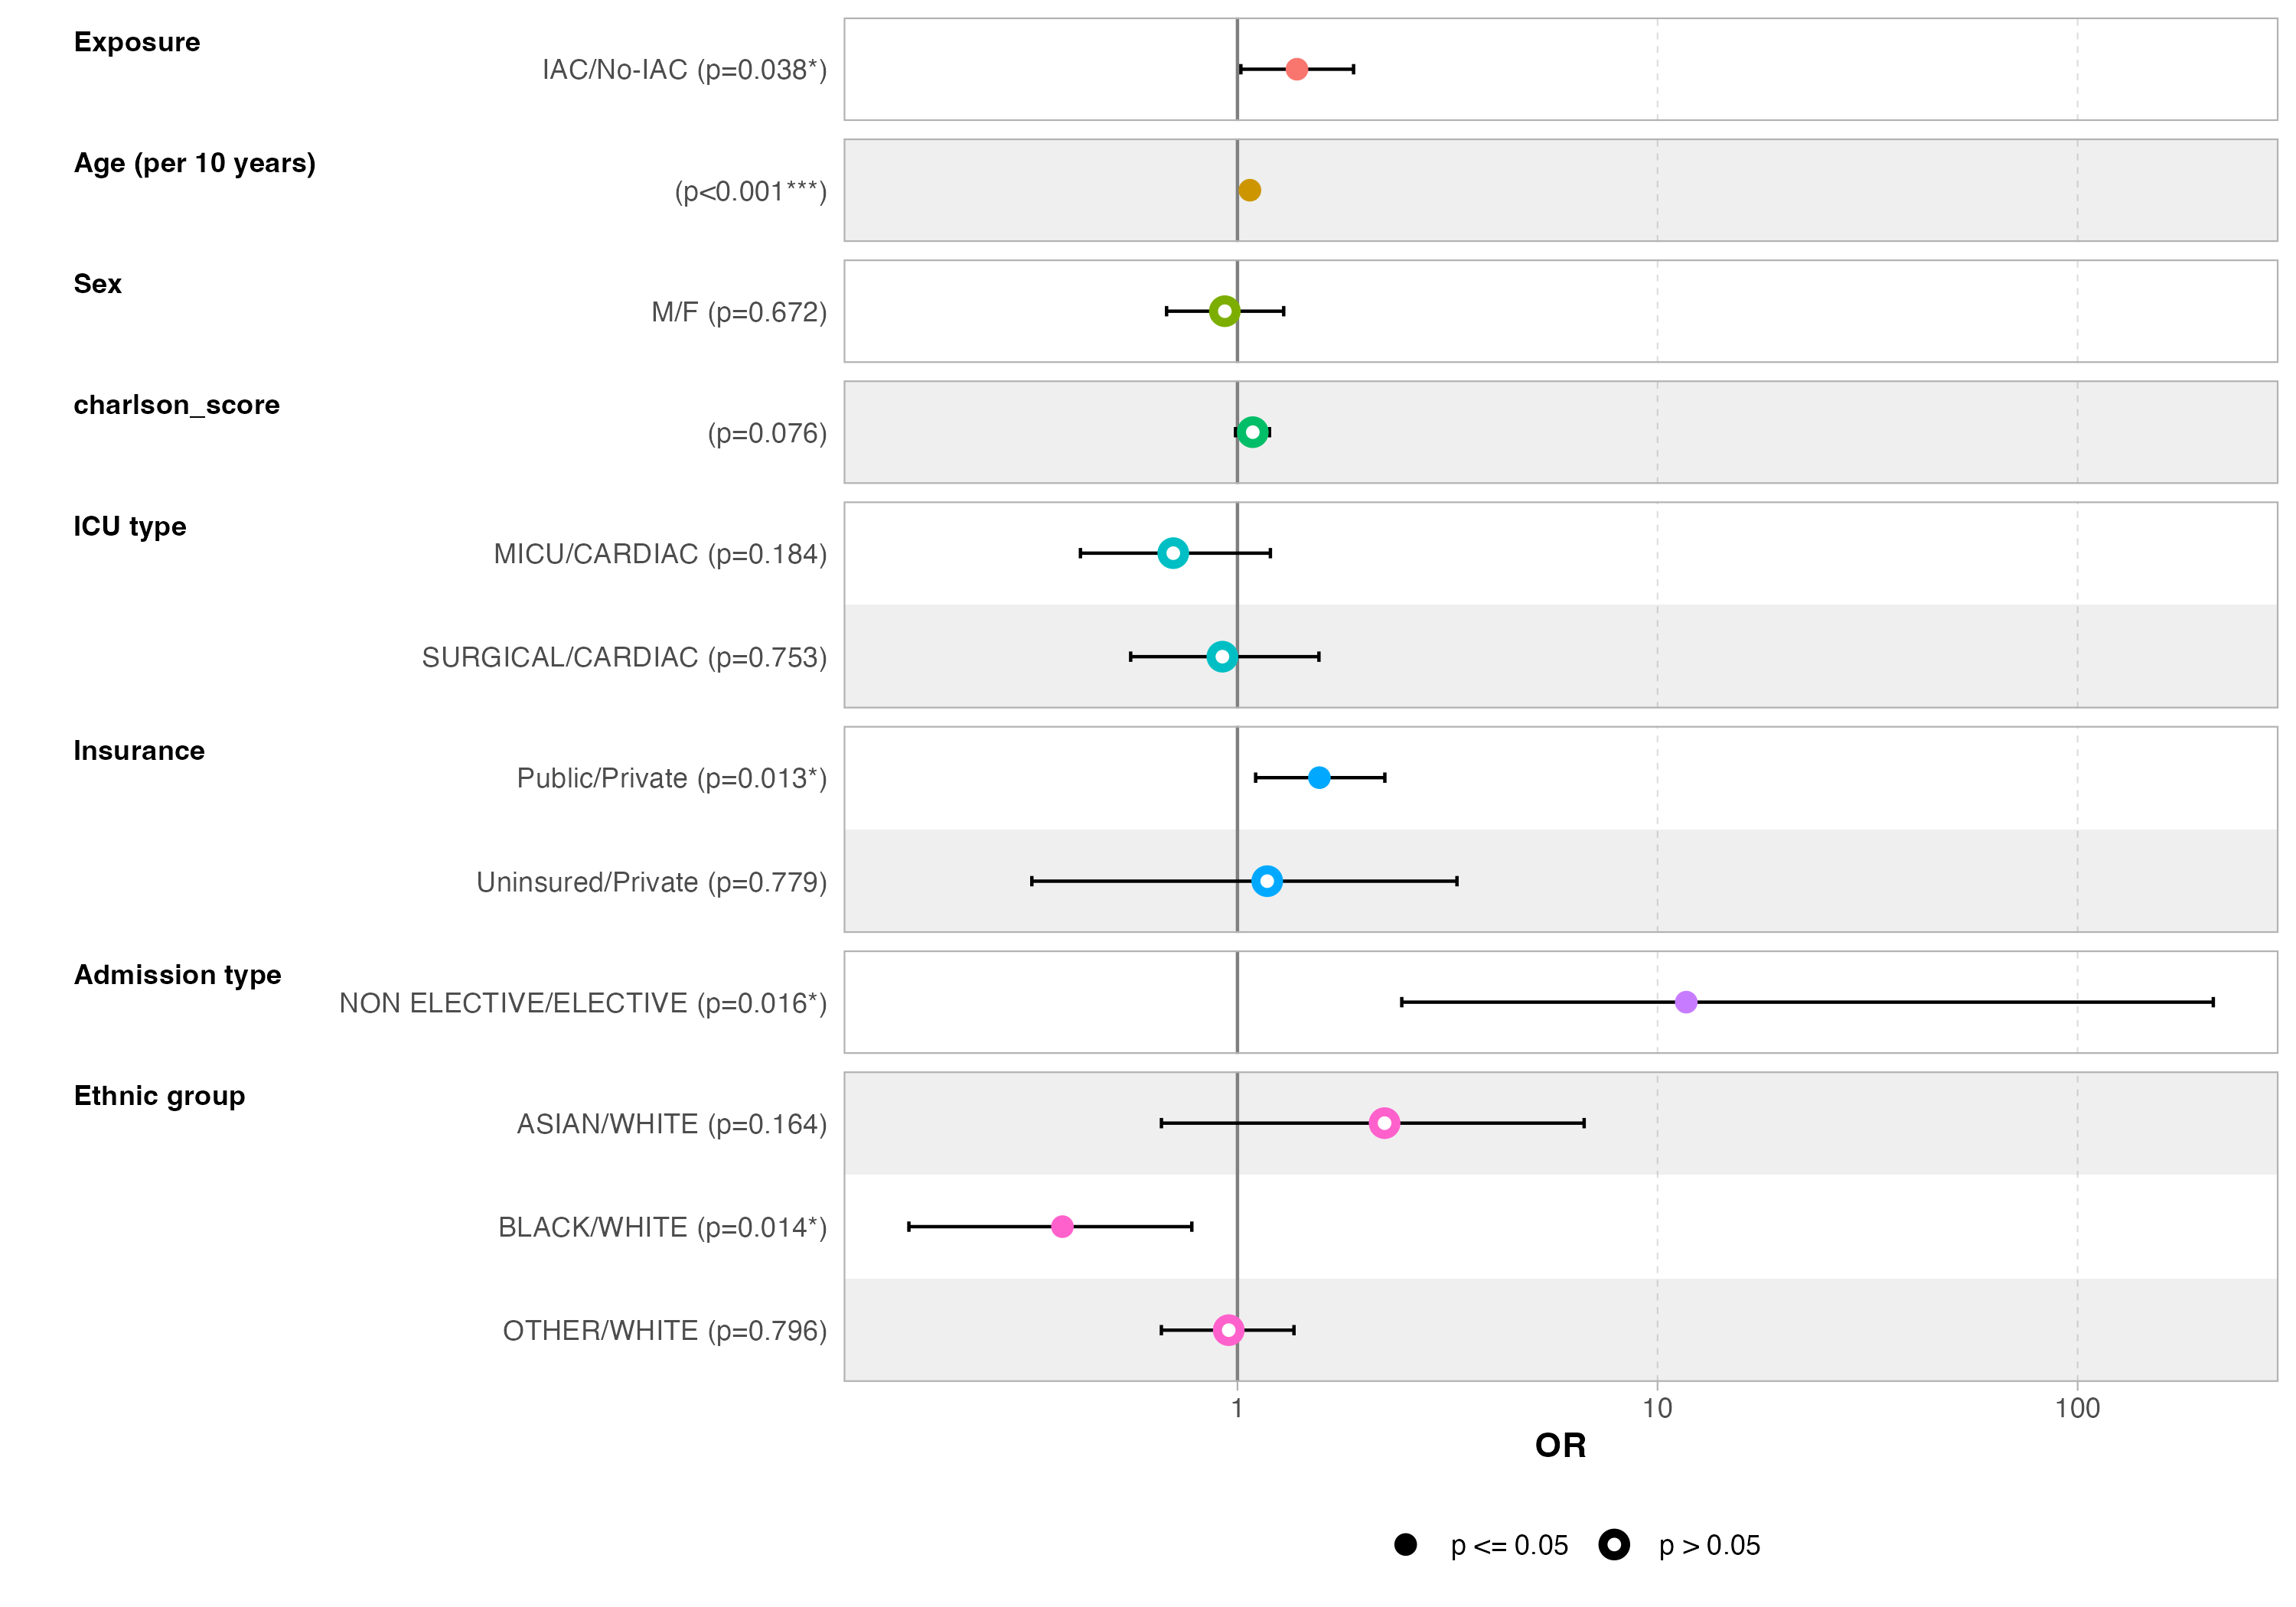
In the inverse probability of treatment weighted (IPTW) analysis, which estimates the average treatment effect in the overall population, arterial line placement was associated with a significantly lower odds of 28-day mortality (aOR = 0.33, 95% CI 0.15–2.07, p = 0.03). However, the wide confidence interval suggests substantial uncertainty around the magnitude of the effect, likely reflecting residual variability and limited effective sample size.
Comparison of causal estimands
Results differed according to the causal estimand and analytical approach. Propensity score matching, which targets a conditional treatment effect among clinically comparable patients, suggested a modest protective association between arterial line placement and 28-day mortality.
In contrast, inverse probability of treatment weighting (IPTW), estimating the average treatment effect in the overall population, yielded a stronger but less precise effect estimate, reflecting increased variability and sensitivity to model specification.
Conclusion
Taken together, these findings suggest possible heterogeneity of treatment effect, with arterial line placement potentially benefiting selected patient subgroups rather than conferring a strong, uniform population-wide mortality benefit.
Ousmane Diallo, MPH-PhD – Biostatistician, Data Scientist & Epidemiologist based in Chicago, Illinois, USA. Specializing in SAS programming, CDISC standards, and real-world evidence for clinical research.
Back to top