RWE Reproduction Project: Antibiotic Resistance Surveillance in Southeast France.
Note: All plots labeled “Original published figure” are taken from Diallo et al., Scientific Reports (2020).
All analytical steps in this portfolio project (data structure design, data cleaning, harmonization of AST results, resistance calculations, DTR classification, and statistical workflow) are reproduced using fully simulated datasets to ensure GDPR and data protection compliance.
No original isolate-level or patient-level data were reused.
Overview
This portfolio project reconstructs the analytical workflow and Real-World Evidence (RWE) methodology from the peer-reviewed publication:
Diallo OO et al. Major discrepancy between factual antibiotic resistance and consumption in South of France. Scientific Reports 2020;10:18262.
The goal is not to reproduce the original results, but to demonstrate the full RWE analytic pipeline using synthetic data modeled after the real-world microbiology surveillance network used in the publication.
This approach allows:
- faithful reconstruction of the study design,
- demonstration of large-scale RWE data engineering skills,
- reproduction of the DTR classification approach,
- and illustration of AMR trend analysis techniques—
while remaining fully compliant with GDPR and ethical requirements.
Original figures from the publication are included for scientific context and comparison.
Background
Antimicrobial resistance (AMR) is often quantified using predictive mathematical models, which may not reflect real-world patterns.
The Scientific Reports study analyzed 539,037 bacterial isolates collected across 267 laboratories to quantify:
Real-world resistance trends over time
Discrepancies between resistance and antibiotic consumption
Prevalence of Difficult-to-Treat (DTR) phenotypes (Kadri et al.)
Temporal evolution of key pathogens (E. coli, K. pneumoniae, S. aureus, A. baumannii…)
This portfolio project reproduces the analytic strategy, statistical logic, and visual narratives using simulated data.
Objectives of This RWE Reproduction
Reconstruct the study design used in the original 2020 publication.
Create a clean analytic workflow using modern RWE standards.
Simulate datasets matching the structure and distribution of the original study.
Reproduce key indicators:
Resistance to key antibiotics
Temporal trends (2014–2018)
DTR classification
Produce RWE-style visualizations (forest plots, timeline trends).
Summarize clinical and public health implications.
This exercise demonstrates RWE reproducibility, analytical rigor, and epidemiological reasoning, essential in the pharmaceutical industry.
Real-World Data Structure (Simulated Version)
The original study used routine-care laboratory data from:
BALYSES (real-time bacterial monitoring system)
MARSS (Marseille AMR surveillance)
PACA SurvE (regional epidemiology system)
To maintain ethical compliance, this portfolio project uses:
simulated datasets
distributions calibrated on published tables
aggregate-level counts consistent with Scientific Reports 2020
The following data elements are reproduced:
Sample type (urine, blood culture, deep, respiratory)
Bacterial species (15 most frequent clinical pathogens)
Antibiotic susceptibility test (AST) outcomes
Key antibiotics for each species
Year of isolation
DTR phenotype classification
Methods (Reconstructed)
Study Design
Retrospective, observational, non-interventional RWD study (2014–2018).
No linked clinical data (mortality, comorbidity).
Unit of analysis: isolate, not patient.
Inclusion Criteria
Isolates from the 15 most frequent pathogens.
At least one key antibiotic tested per species.
Resistance Definition
EUCAST breakpoints
Intermediate considered resistant (per original study)
DTR Classification
Reproduced using the Kadri et al. algorithm:
GNB: resistant to all β-lactams, carbapenems, and fluoroquinolones
Gram-positive: resistant to (methicillin + gentamicin + vancomycin) or equivalent triads
Statistical Modeling
Mann–Whitney U
χ² and Fisher exact tests
Kendall correlation for trends
p < 0.05 considered significant
This statistical logic is faithfully reconstructed.
Key RWE Insights (From Simulated Reproduction)
Although data are simulated, trends reproduce the structure of published findings:
1. Resistance trends remained globally stable (2014–2018)
Global stability across most pathogen–antibiotic pairs
No major shifts in S. aureus, Enterobacterales, or P. aeruginosa
Clear exceptions highlighted below
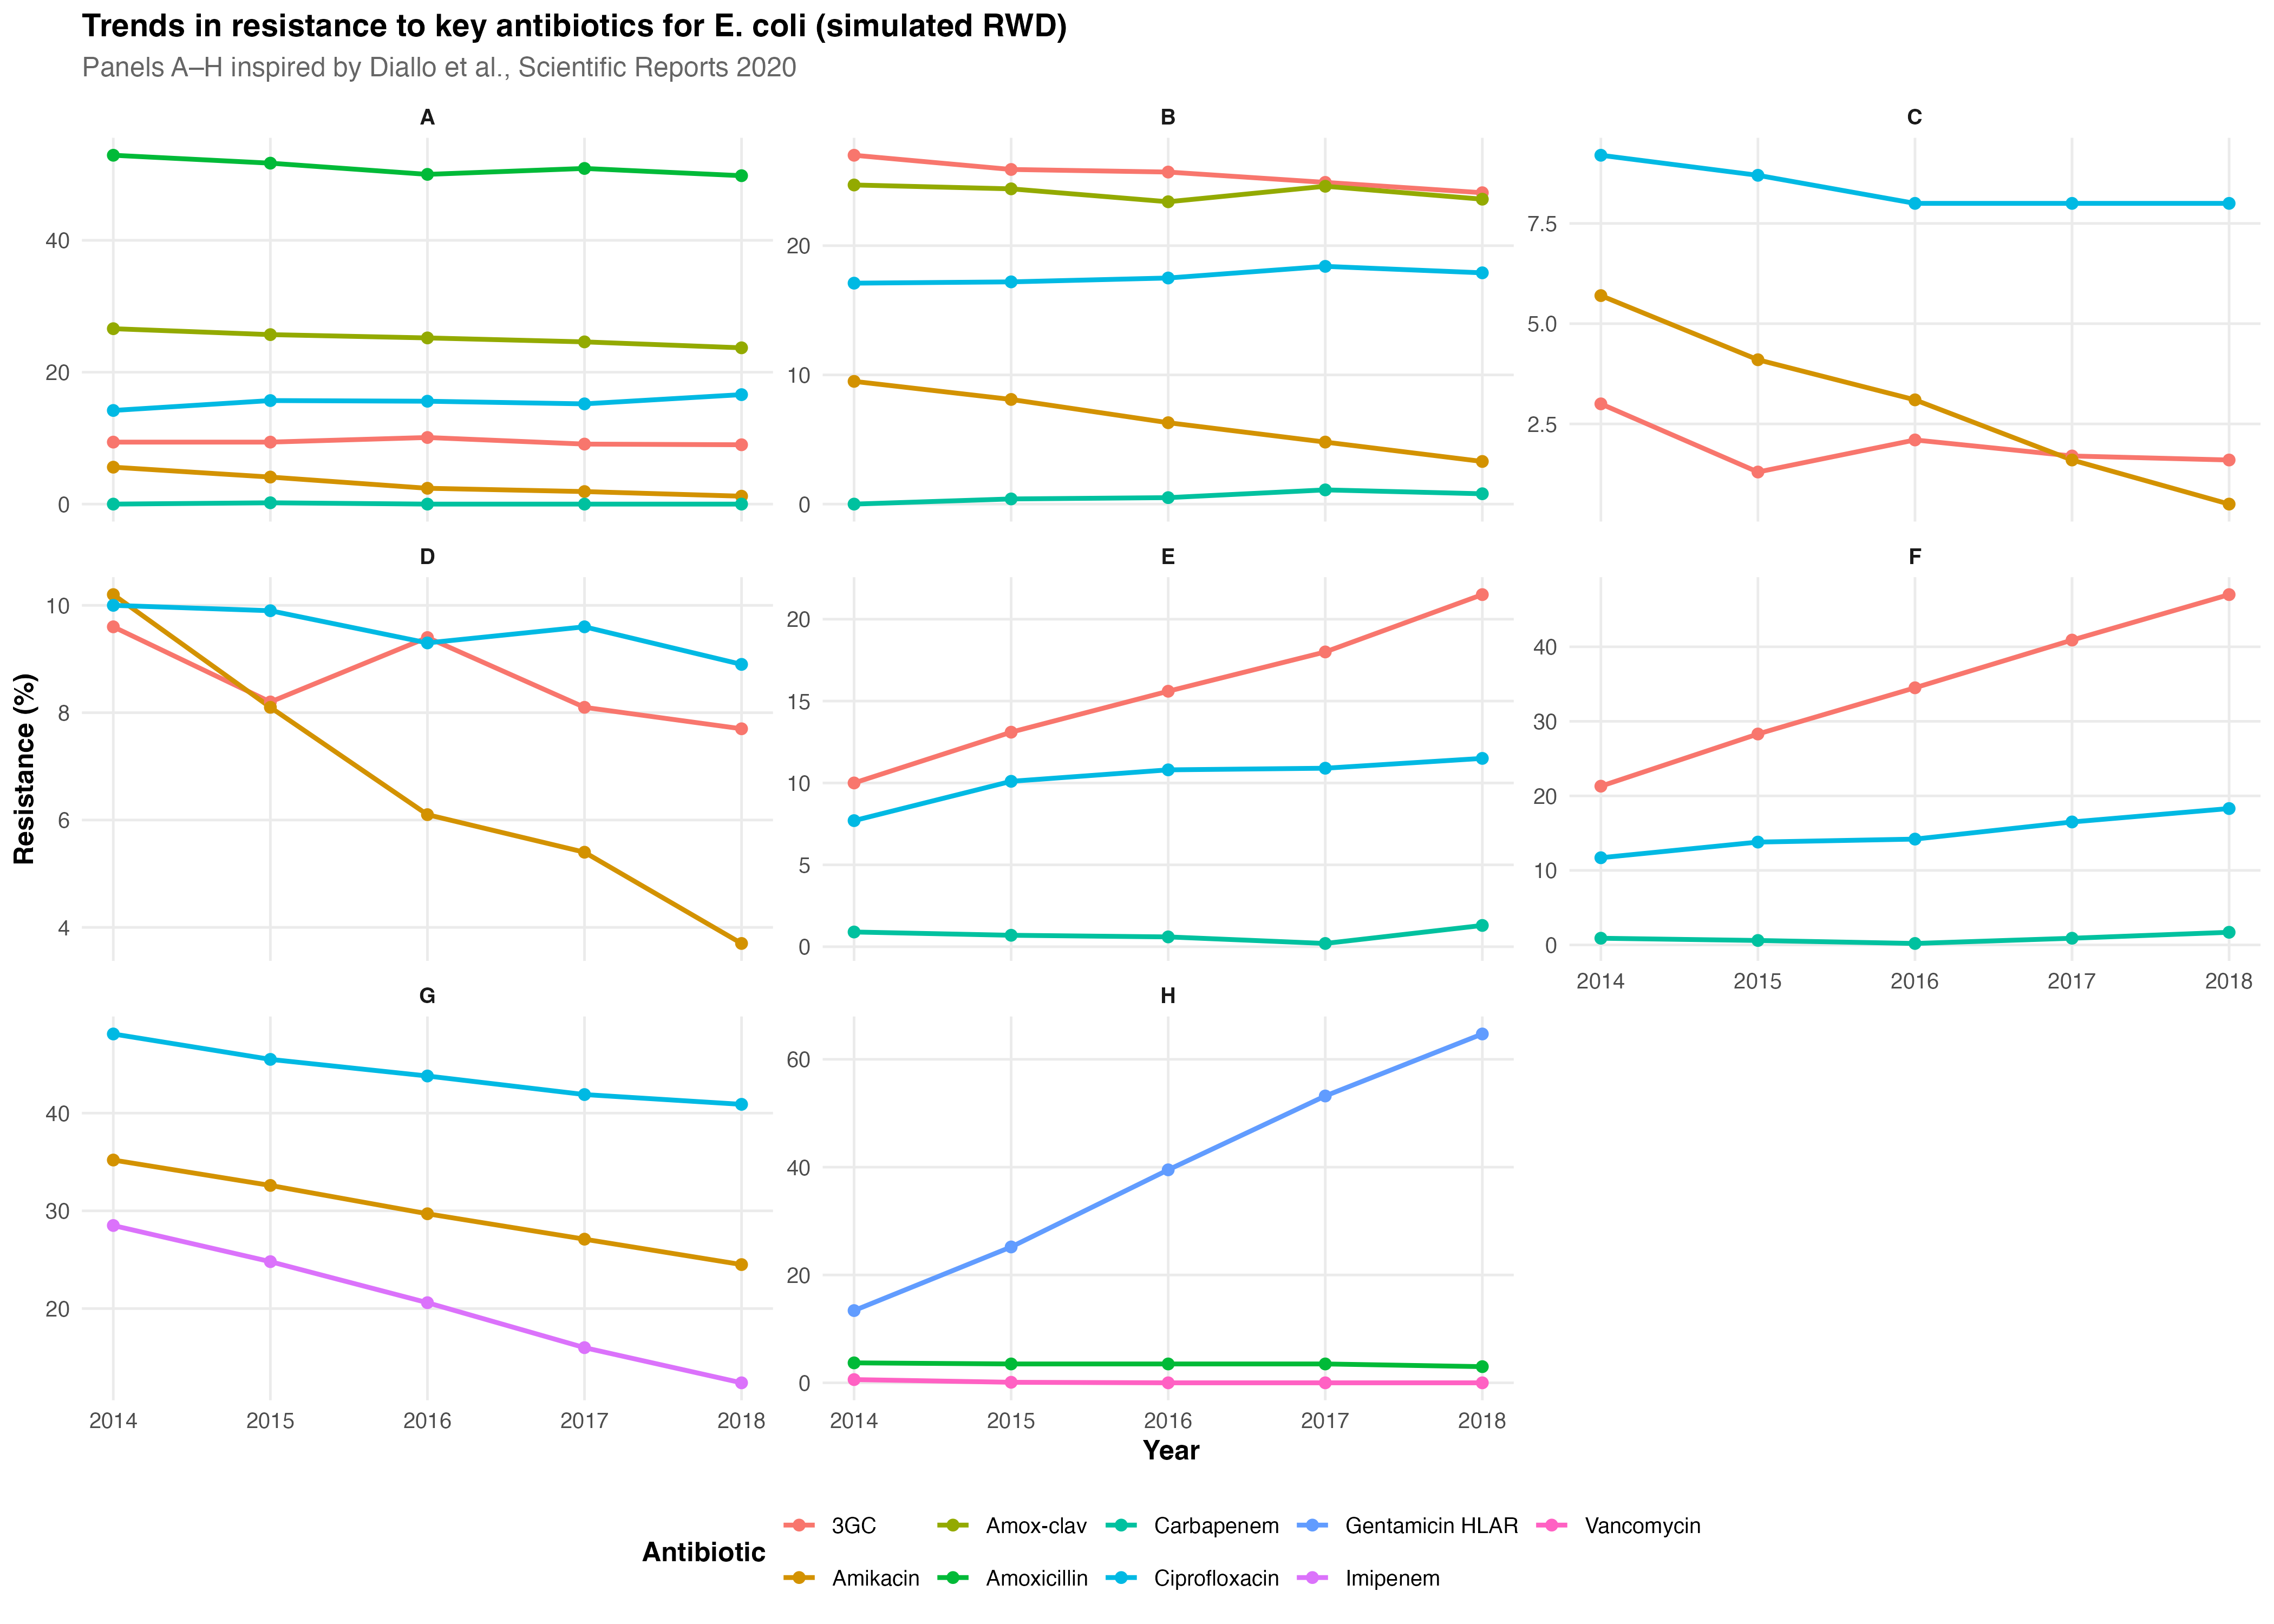
2. Significant reductions in resistance
Amikacin resistance decreased in E. coli, K. pneumoniae, P. mirabilis, K. oxytoca.
Imipenem resistance declined in A. baumannii.
3. Significant increases in resistance
- Ceftriaxone resistance in:
E. cloacae
K. aerogenes
K. oxytoca
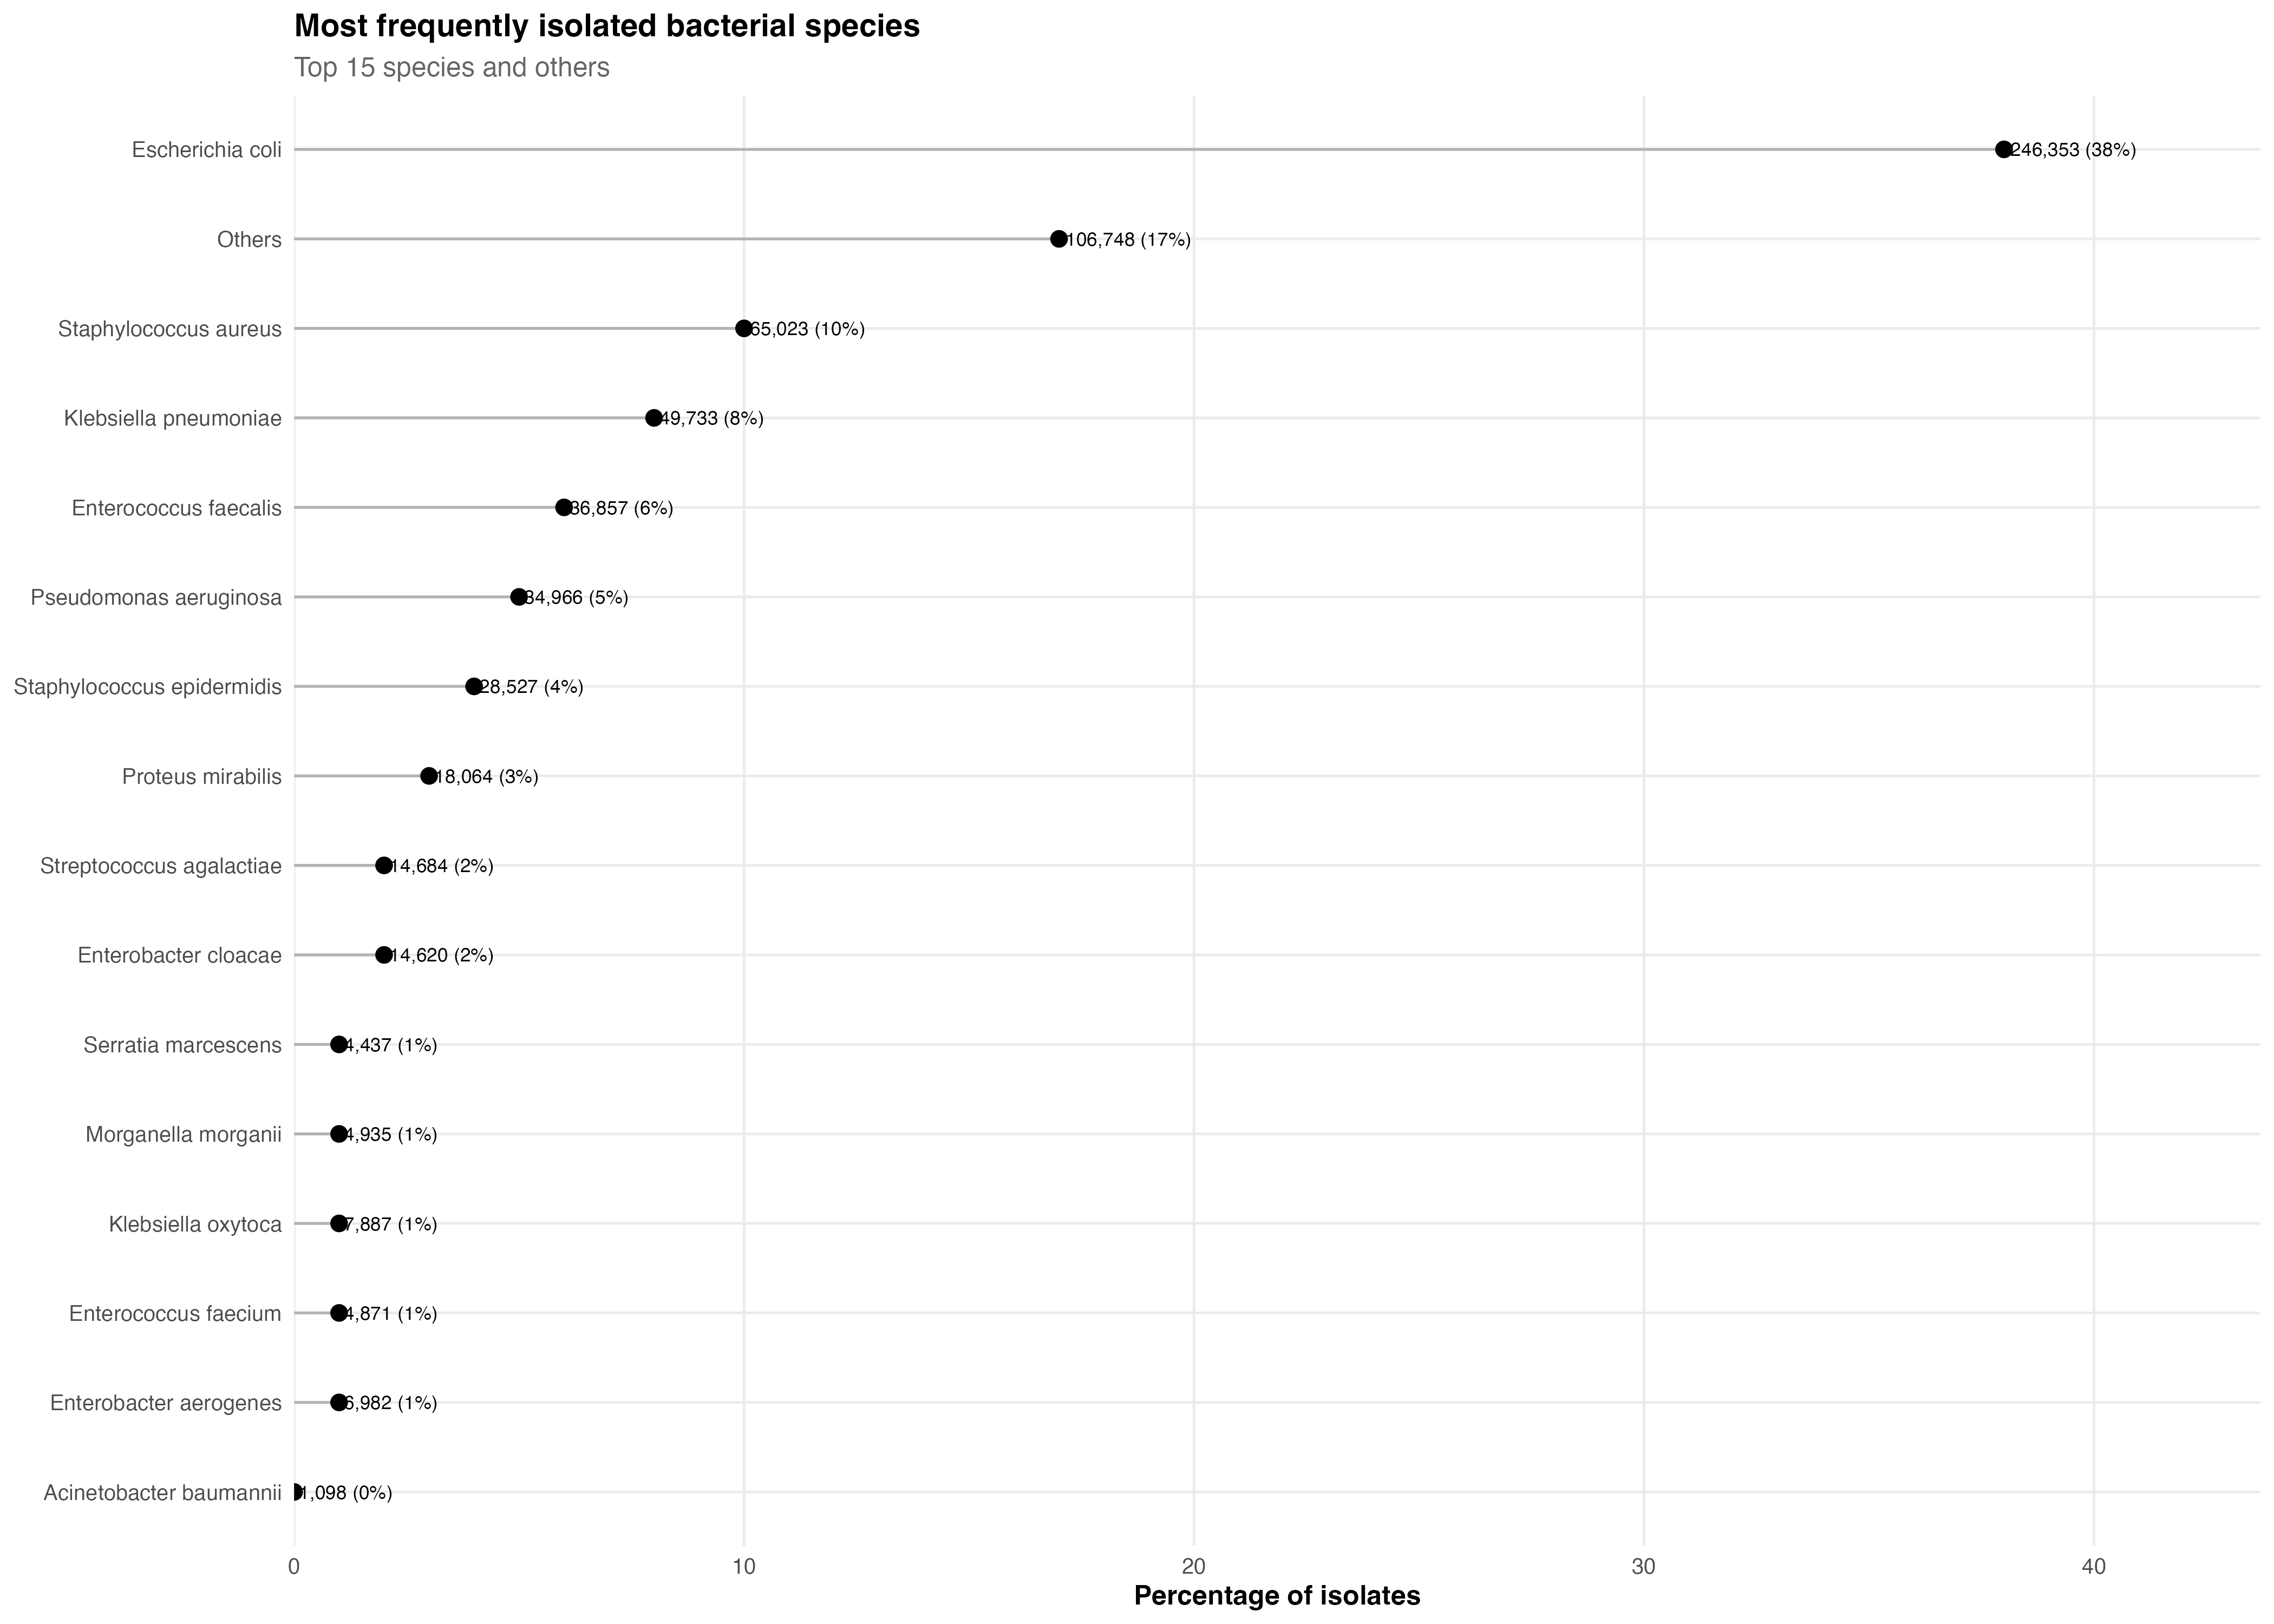
Species distribution (simulated RWD)
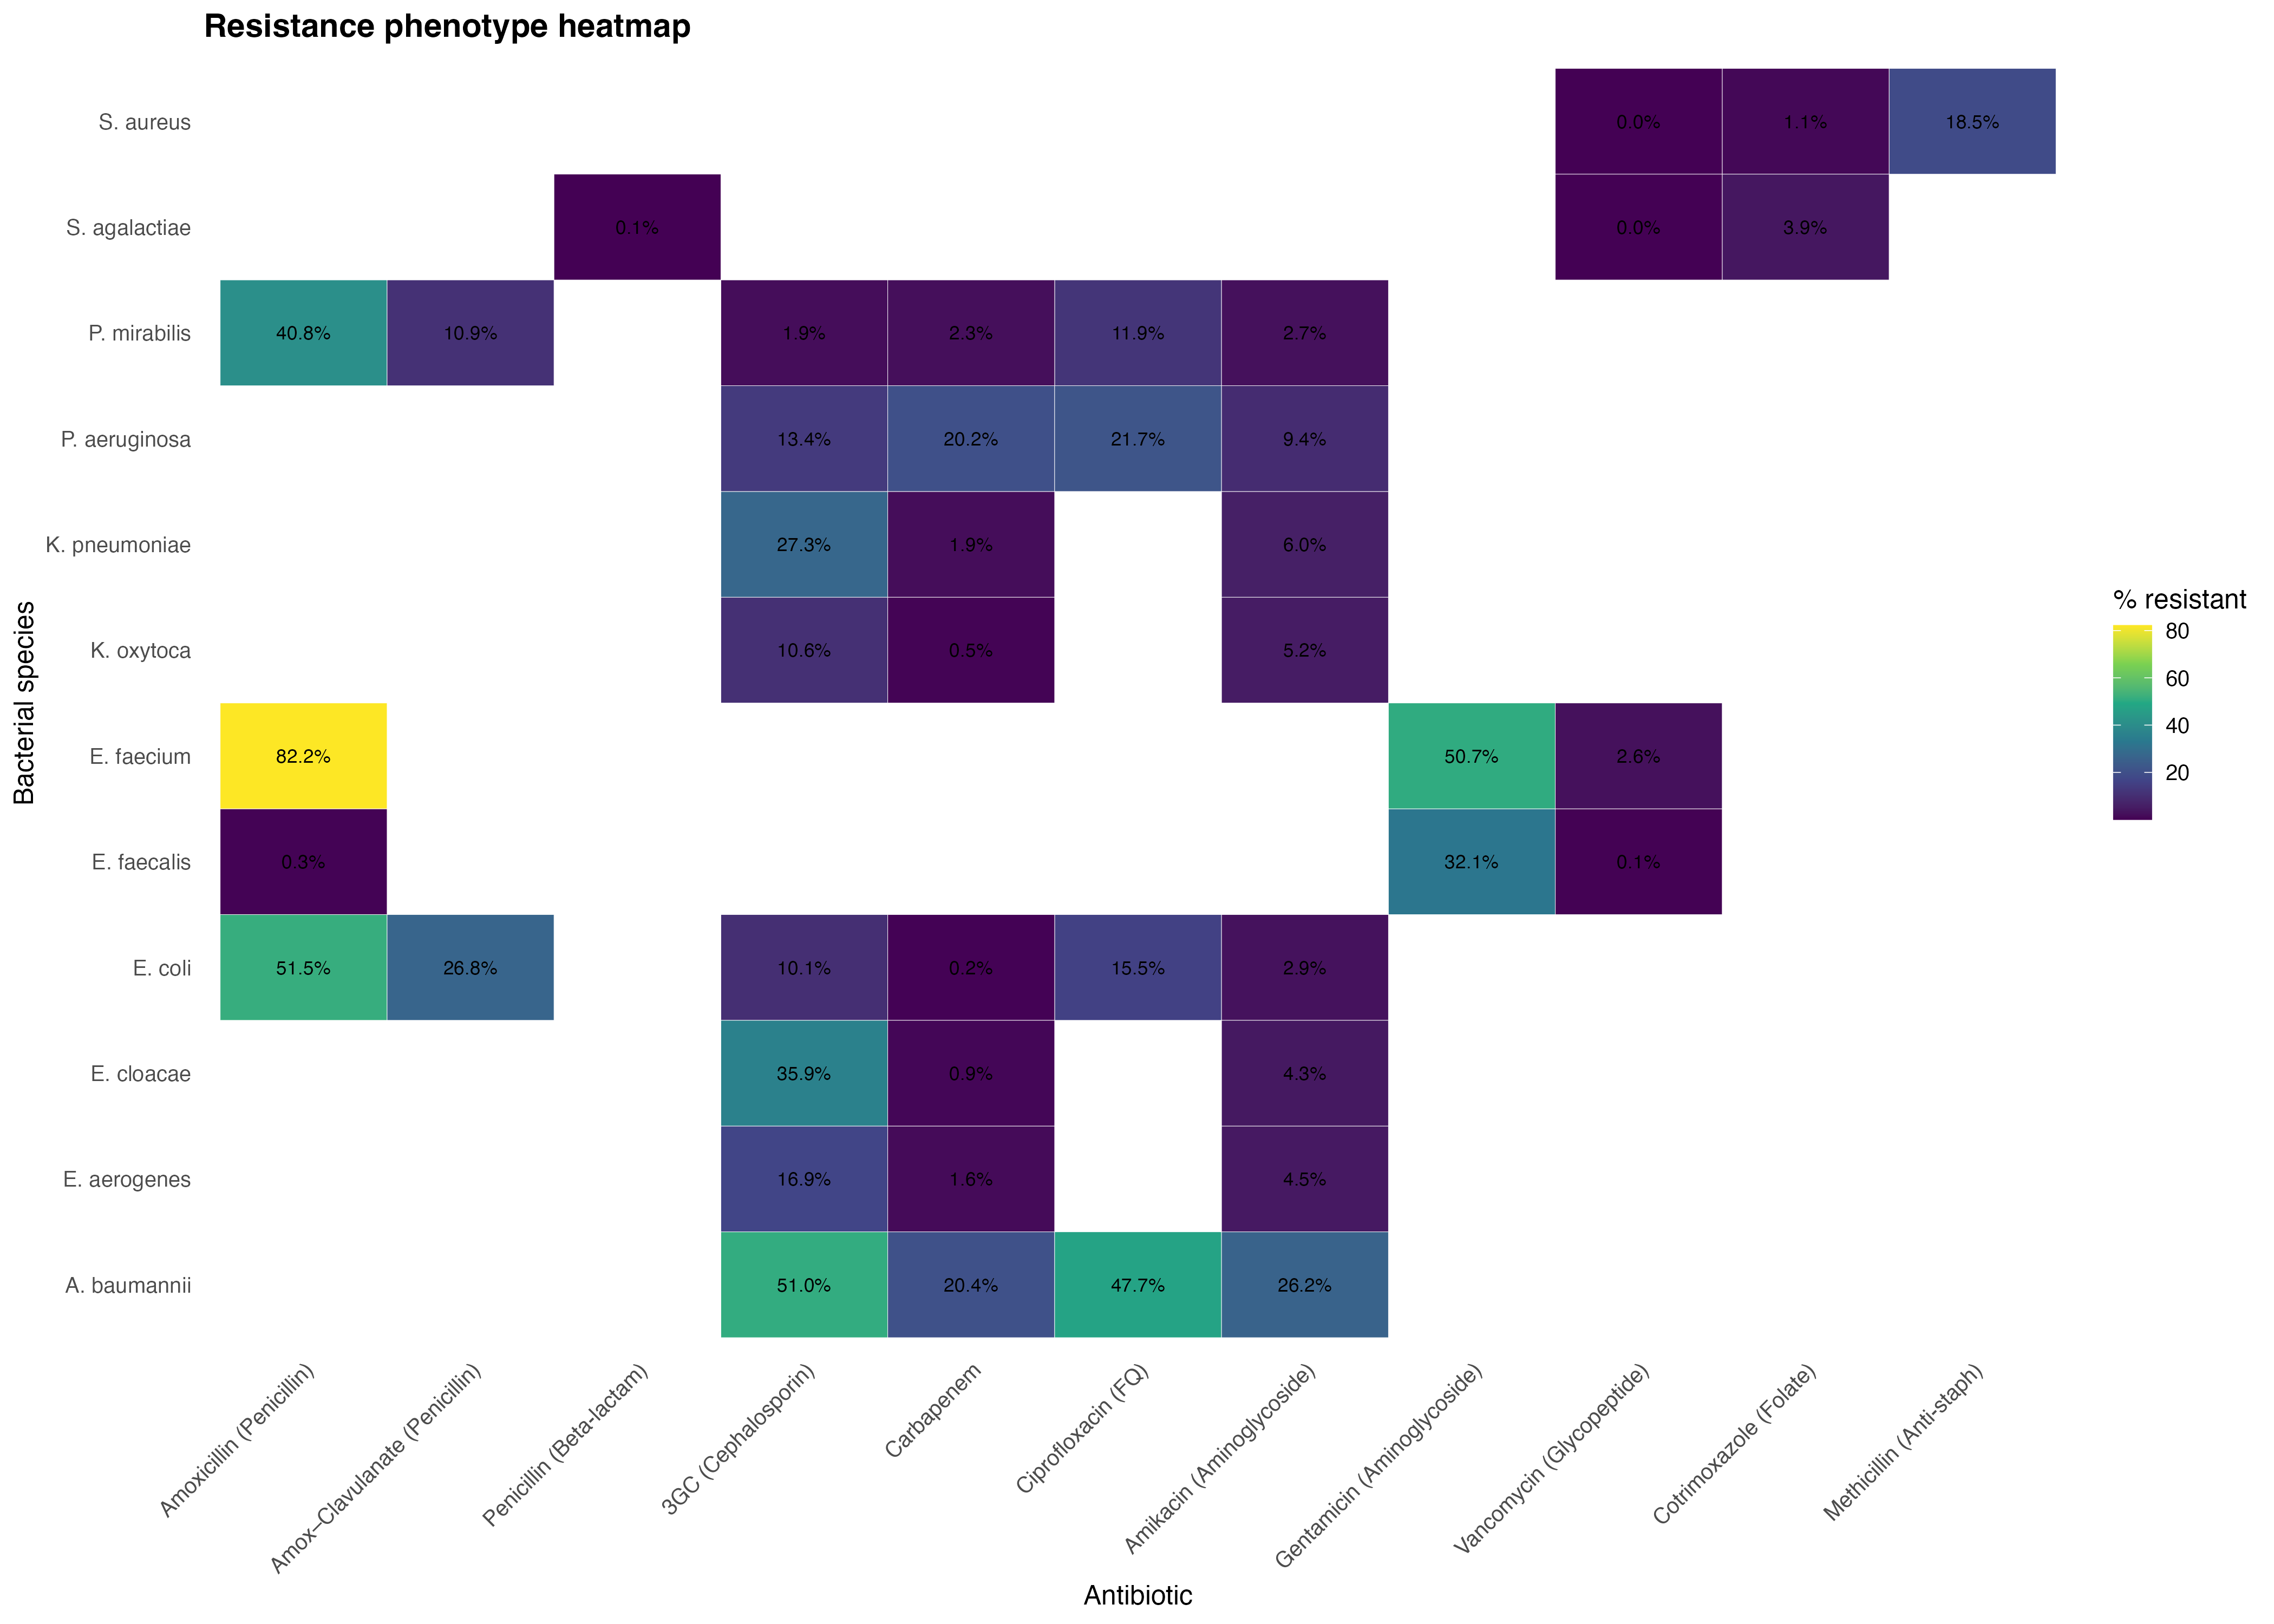
4. Resistance profiles across pathogens
This heatmap summarizes the resistance phenotypes by pathogen and antibiotic class, highlighting strong resistance clusters (e.g., E. faecium, A. baumannii) and preserved susceptibilities in Gram-positive organisms.
5. Prevalence of DTR Phenotypes
0.3% of isolates
Mostly Gram-negative
Lower than rates reported in U.S. hospital networks
No upward trend observed
Table 5a. Prevalence of Difficult-to-Treat Resistance (DTR) phenotypes in the PACA region (January 2014 – February 2019)
| Bacterial species | DTR strains (n / total) | Percentage (%) |
|---|---|---|
| Escherichia coli | 85 / 246,353 | 0.03 |
| Klebsiella pneumoniae | 372 / 49,733 | 0.74 |
| Klebsiella oxytoca | 11 / 7,887 | 0.13 |
| Proteus mirabilis | 1 / 18,064 | 0.006 |
| Serratia marcescens | 3 / 4,437 | 0.07 |
| Morganella morganii | 5 / 4,935 | 0.10 |
| Enterobacter cloacae | 33 / 14,620 | 0.20 |
| Enterobacter aerogenes | 6 / 6,982 | 0.09 |
| Pseudomonas aeruginosa | 902 / 34,966 | 2.60 |
| Acinetobacter baumannii | 175 / 1,098 | 15.90 |
| Enterococcus faecalis | 3 / 36,857 | 0.008 |
| Enterococcus faecium | 5 / 4,871 | 0.10 |
| Staphylococcus aureus | 0 / 65,023 | 0.00 |
| Staphylococcus epidermidis | 3 / 28,527 | 0.01 |
| Streptococcus agalactiae | 0 / 14,684 | 0.00 |
| Total | 1,604 / 539,037 | 0.30 |
Table 5b. Comparison of DTR prevalence between PACA region and 173 U.S. hospitals (Kadri et al., 2018)
| Bacterial species | DTR strains (n / total) | Percentage (%) | U.S. hospitals (Kadri 2018) |
|---|---|---|---|
| Escherichia coli | 85 / 246,353 | 0.03 | 0.04 |
| Klebsiella pneumoniae | 372 / 49,733 | 0.74 | 1.70 |
| Enterobacter cloacae | 33 / 14,620 | 0.20 | 0.60 |
| Enterobacter aerogenes | 6 / 6,982 | 0.09 | 0.60 |
| Pseudomonas aeruginosa | 902 / 34,966 | 2.60 | 2.30 |
| Acinetobacter baumannii | 175 / 1,098 | 15.90 | 18.30 |
| Total | 1,573 / 353,752 | 0.44 | 1.01 (471/46,521) |
Clinical & Public Health Interpretation
This project supports the central conclusion of the 2020 Scientific Reports article:
High antibiotic consumption does not automatically translate into higher resistance.
Predictive AMR models may overestimate the burden in certain contexts.
Real-time laboratory surveillance (RWD) provides a more accurate and actionable picture.
Routine-care AMR data can guide empirical treatment and stewardship programs.
Ethical Considerations
To ensure strict compliance:
No original data from the published study are reused.
Only synthetic, simulated, or aggregated datasets are used.
No identifiable patient information is present.
The project is solely for educational and portfolio purposes.
The analytic framework is recreated, not the dataset.
This aligns with GDPR, HIPAA, and good RWE practice.
Limitations
Simulated data cannot perfectly replicate the distribution of real isolates.
No patient-level linkage (mortality, comorbidities).
Results cannot be used for clinical decision-making.
Geographic specificity limits generalizability.
Conclusion
This RWE reproduction successfully reconstructs the methodological framework and analytical insights from the 2020 Scientific Reports article using modern RWE standards and simulated datasets.
It demonstrates:
Expertise in large-scale AMR surveillance
Mastery of RWE methodologies
Reproducible analytic workflows
Ability to translate published research into data-driven insights
Skills Demonstrated
Real-World Evidence (RWE) methodology
Surveillance epidemiology
Handling large microbiology datasets
Statistical analysis of resistance trends
Implementation of DTR definitions
Data visualization for AMR
Scientific communication
Publication (Referenced)
Diallo OO, Baron SA, Dubourg G, et al. Major discrepancy between factual antibiotic resistance and consumption in South of France. Scientific Reports 2020;10:18262.
Ousmane Diallo, MPH-PhD – Biostatistician, Data Scientist & Epidemiologist based in Chicago, Illinois, USA. Specializing in SAS programming, CDISC standards, and real-world evidence for clinical research.
Back to top